Troubleshooting#
If you experience any bugs or unexpected behavior, please let us know. We will do our best to help you.
Security Vulnerability?
If you discovered a security vulnerability in SunPeek, please follow these steps:
Contact support@sunpeek.org directly.
Provide a short description.
Do not create a public issue.
We will get in touch with you as soon as possible.
Did you find a bug?#
When you encounter a bug using the WebUI, you can use the built-in reporting feature: Click the “Report this issue” button included in error banners. This automatically generates a diagnostic file and composes a pre-filled email support request.
Reporting bugs
To report a bug, please contact our support at support@sunpeek.org. Please include:
Description of what you were doing when the error occurred and what behavior you expected.
Steps to reproduce the problem
Screenshots, if helpful
The diagnostic file debug_dump.json, auto-generated by “Report this issue”
Thank you for helping us improve this open-source software!
Note
Want to contribute to resolving a bug? See the Contributing Guide for how to search existing issues and submit new ones on GitLab.
How Errors Are Displayed#
When SunPeek encounters an error, it displays an error banner with the following components:
Bug icon: A red bug icon (mdi-bug) in the top left
Status code header: Indicates the error type (e.g., “Error 400”, “Error 0”)
Report this issue button: See “Report this issue” button for details
Message field: User-friendly explanation of what went wrong
Detail field: Technical information to help diagnose the issue
Dismiss icon: “X” icon (top right) to close the banner
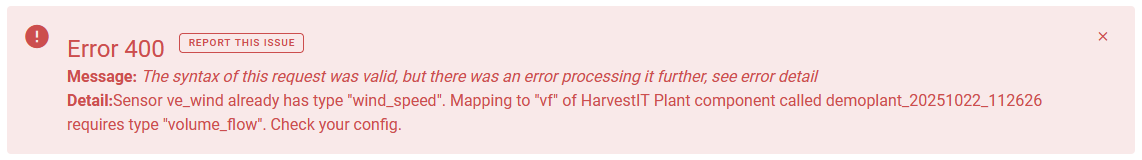
Example error banner with all components.#
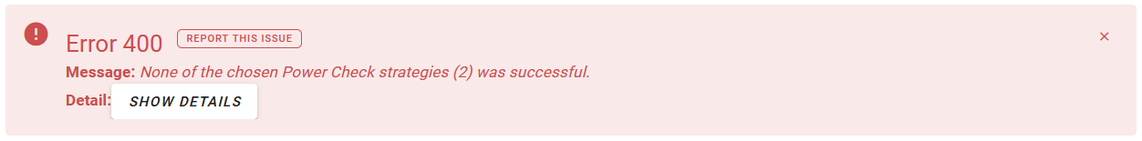
For long error details (more than 300 characters), a “SHOW DETAILS” button appears in the error banner. Clicking it opens a modal dialog displaying the full error details:
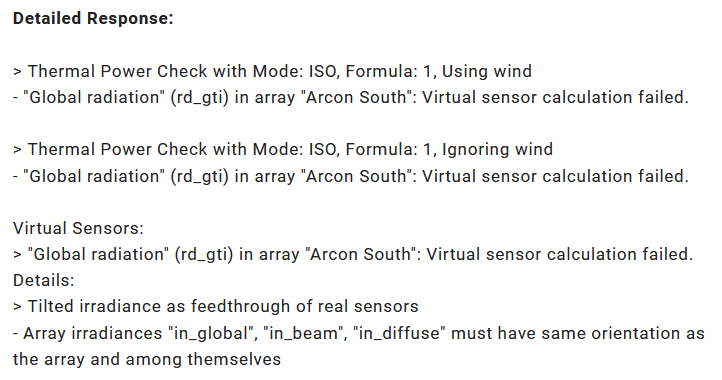
Dialog with detailed error information after clicking the “SHOW DETAILS” button.#
Connection Problems#
If the WebUI cannot connect to the backend API or database, you’ll see a connection status page showing which components are unreachable and suggesting what to do. This typically happens when:
Docker containers are not running or have crashed
Network connectivity issues prevent the frontend from reaching the backend
The backend service is starting up (may take a few minutes)
AdBlockers or VPN clients interfere with local connections
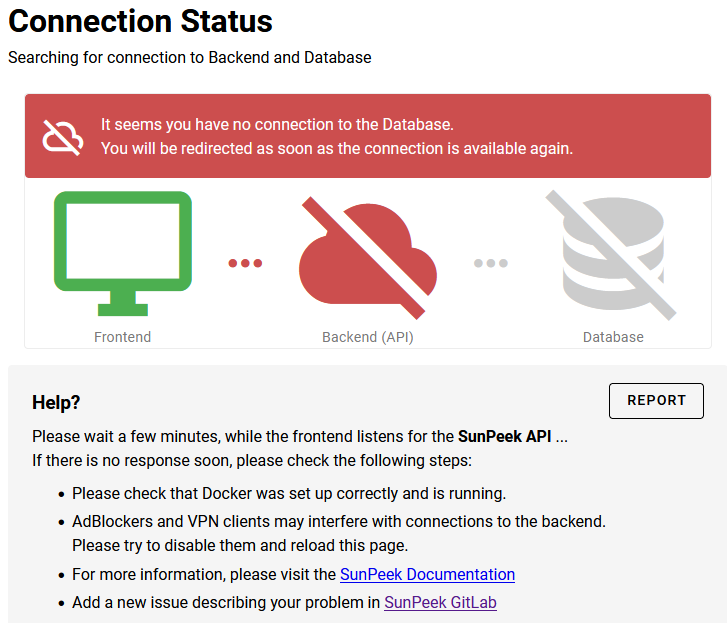
Connection status page displaying connectivity issues and troubleshooting guidance.#
Reporting Problems#
“Report this issue” button#
Error banners include a “Report this issue” button that performs a two-step process:
Downloads a
debug_dump.jsonfile containing system diagnostics.Opens your email client with a pre-filled support request including the diagnostics file.

“Report this issue” button in an error banner.#
Debug dump file#
The debug_dump.json file contains system information that helps diagnose problems, including:
SunPeek version and configuration
Browser information
Error details and stack traces
Plant configuration (if applicable)
What You Can Do#
Here are general troubleshooting actions you can take when encountering errors:
Dismiss and retry: Close the error banner and try the operation again. Temporary issues sometimes resolve themselves (e.g., network hiccups, transient server problems).
Check your configuration: For validation errors, review the affected settings; the error detail often indicates which field needs attention. For data upload error handling details, see Data Upload.
Check Docker logs: For network or server errors, inspect container logs for additional information using
docker logs <container_name>. Look for error messages, stack traces, or warnings that provide more context about the problem.Report the issue: If the error persists or is unclear, use the built-in reporting feature.
Common Errors#
Network Error (Status 0)
Meaning: The frontend cannot reach the backend API. This usually means the database is offline or the API is unreachable.
What to do:
Check that Docker containers are running:
docker psReview Docker logs for additional information:
docker logs <container_name>Verify network connectivity between frontend and backend
Bad Request (Error 400)
Meaning: The request was valid but could not be processed by the backend due to invalid configuration, missing data, or data validation errors. This commonly occurs with:
Invalid datetime formats or timezone-naive timestamps
Missing required fields in configuration
Data upload issues (missing timestamps, mismatched sensor names)
Invalid Power Check settings (e.g., negative values, out-of-range parameters)
What to do:
Check the error detail; it provides specific information about what’s invalid
Verify datetime formats: Use ISO 8601 format with timezone (e.g.,
2024-01-01T12:00:00+01:00) or include a separate timezone parameterReview configuration values: Ensure all required fields are filled and values are within valid ranges. Also check sensor information (e.g. radiation sensor orientation)
Data uploads: Verify that CSV columns match sensor names and contain valid timestamps
If the error persists, use the “Report this issue” button to get help
Server Error (Status 500)
Meaning: A critical error occurred in the backend API while processing your request.
What to do:
Check Docker logs for detailed error information and stack traces
Report the issue using the “Report this issue” button
SensorDataNotFoundError
Meaning: A sensor is configured in the plant configuration, but the underlying data column is missing or misnamed in the database.
What to do:
Ensure data has been uploaded for the sensor (database columns are only created once data is uploaded)
Verify sensor column names match your data files exactly
Check the sensor mapping configuration
Note
This is the most common error when using SunPeek as a web application. It typically occurs when sensors are added to configuration before uploading data for them.
NoDataError
Meaning: No data is available in the selected time range for the requested analysis.
What to do:
Adjust the date range to match your uploaded data
Upload additional data if needed
Verify data was uploaded successfully
ConfigurationError
Meaning: The plant configuration contains invalid or inconsistent settings.
What to do:
Review plant configuration settings carefully
Check the error detail for specific field issues
Ensure all required fields are filled in correctly
Verify units, formats, and value ranges
TimeZoneError
Meaning: There is a timezone mismatch or invalid timezone information in your data or configuration.
What to do:
Check timezone settings in plant configuration
Verify data file timestamps are in the expected timezone
Ensure timezone strings are valid (e.g., “UTC”, “Europe/Vienna”)
PowerCheckError
Meaning: The Power Check analysis cannot be performed with the current configuration or data.
What to do:
Ensure all required sensors are mapped correctly
Verify data exists for the selected time range
Check that sensor data is valid (no NaN values, reasonable ranges)
See the Sensor Data page for data quality information
Unexpected calculation error
Meaning: An error occurred during internal calculations (virtual sensors, Power Check, D-CAT). This is typically related to unexpected numeric problems or issues in external libraries used by specific calculations.
What to do:
Use the “Report this issue” button to help improve software robustness
Check Docker logs for the full error trace:
docker logs <container_name>The
debug_dump.jsonfile will be automatically included when you report the issue
Note
The full error trace is recorded in the backend log files. Your system administrator can inspect these logs for detailed diagnostic information.