Adding Plants#
This part of the tutorial will help you to set up a new plant with SunPeek.
Tip
The information provided to SunPeek in these steps will be stored in your local Database. Hence, for every plant, this process only needs to be done once!
Plant Information#
In this step we will add our first new plant!
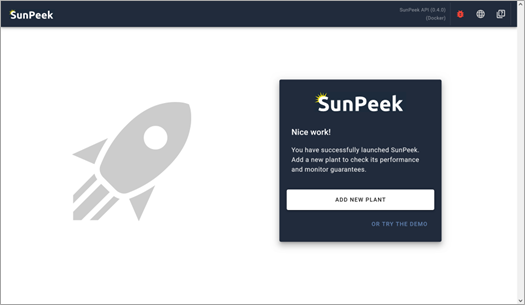
Starting up SunPeek#
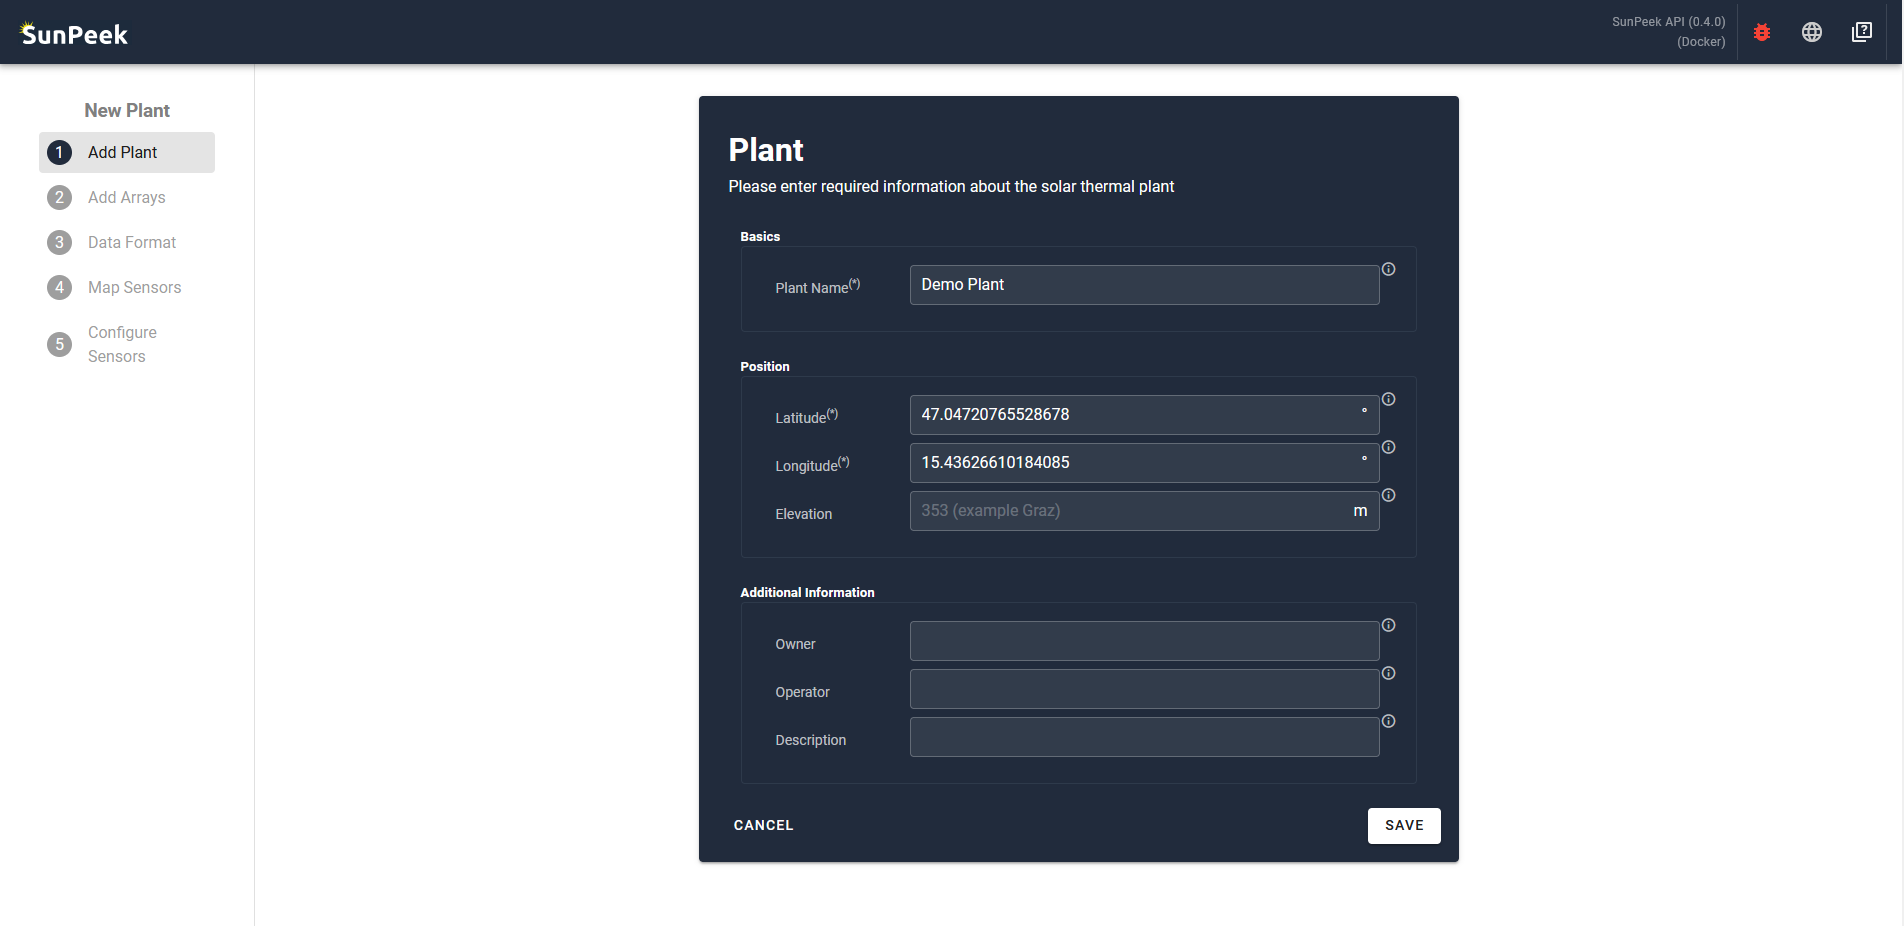
Plant Configuration#

You are now viewing the first of five configuration steps that are needed to setup a new plant. The first step of the configuration deals with parameters that are common for the whole system. For example, longitude and latitude of the plant location. This information is used for calculations (e.g., angle of incidence) and for referencing the system in the overview page (e.g., name of plant, operator, additional description).
In case of the FHW plant, we can use the following values:
Plant Name: Demo Plant
Latitude: 47.04720765528678
Longitude: 15.43626610184085
Hint
If you are unsure about the longitude and latitude of your plant, you can use Google Maps. Just search for your plant (e.g., using the satellite view) and right-click on the correct location. The coordinates are then copied to the clipboard. Enter them into SunPeek, separate them into the corresponding fields, delete the , symbol and you’re done.
General Tips#
Here are some hints and tips about how use SunPeek’s input fields.
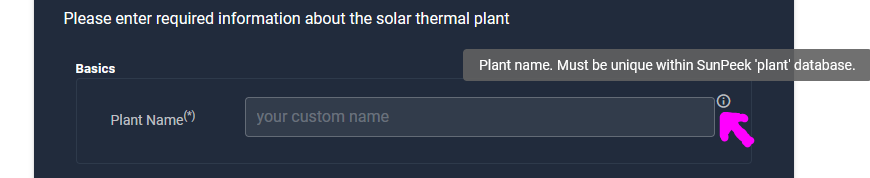
Infotips
Do you want more information about a parameter? Note the icon on the right of the input fields. These are infotips: Hover over these icons to get more information about some parameter.
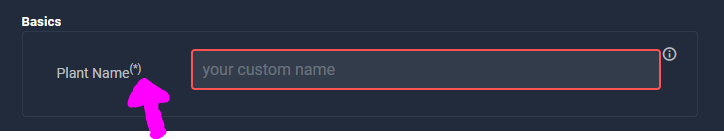
Required Parameter
Parameters marked with (*) are required or mandatory, while other parameters are optional. In case you try to save without specifying a required parameter, the input field will appear red. This is the same in all further input fields.
Collector Fields#
After saving the plant configuration, you will see a page dedicated to adding collector fields.
This step allows the user to define the individual collector fields (also called collector arrays) that should be checked according to ISO 24194. Note that SunPeek explicitly allows to add even multiple collector fields with different collector types.
Why add multiple arrays in SunPeek?
SunPeek calculates a separate estimated yield for each collector field. Hence, it is recommended to add a collector field for each section or the plant you want to check separately. This is important in case you have more than one collector type installed at your plant. Some examples:
If you have a large collector field with only one collector type -> Use 1 array including all the individual collectors.
If you have a large collector field with two different collector types -> Use 2 array - one for each collector type.
If you have two fields of the same collector type -> Either add one array for the total field (if you have measured power for the total) or add two separate array (if the fields are measured separately).
Adding a new Array#
At start the page shows an (initially empty) list of all collector fields for the specific plant. With the “Add Array” button on the upper right, new collectors can be added.
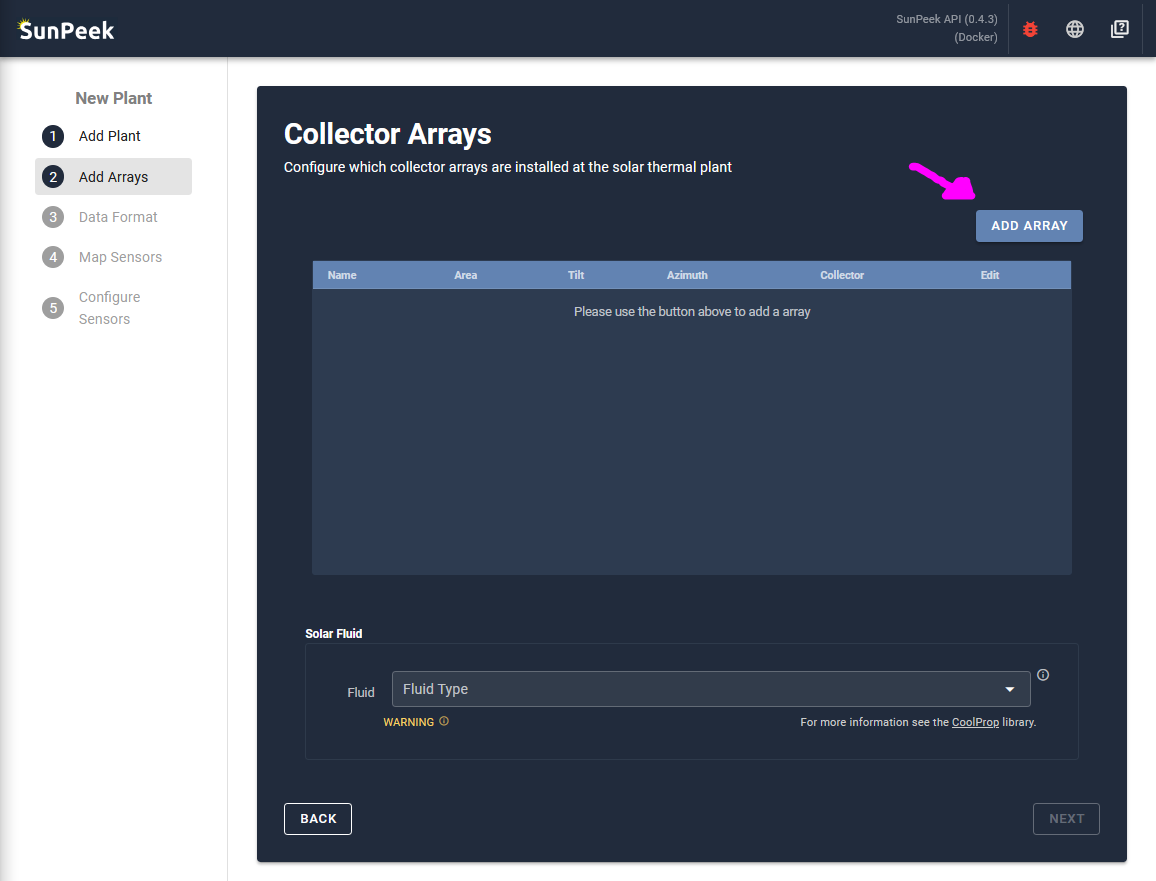
Array Input Form#
When clicking on the button, an input form appears that allows to add a collector field. The information is required to calculate many important variables useful to SunPeek like the angle of incidence or internal shading. More information about each parameter can by viewed by hovering info icon on the right of each input.
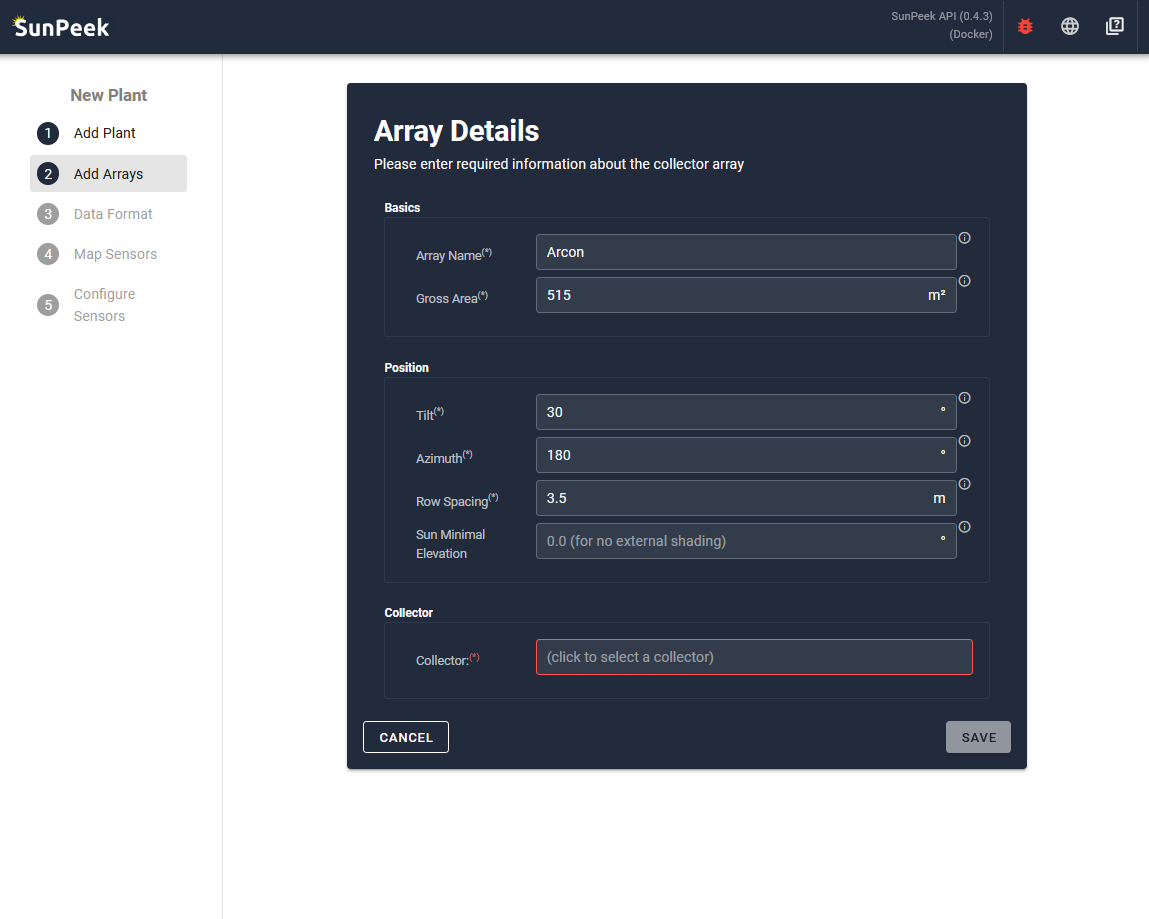
- In the case of the Demo-Plant we add the information about the Arcon Collector field:
Name: Arcon
Collector Area: 515 m²
Collector Tilt: 30°
Collector Orientation: 180° (=towards south)
Row-Spacing: 3.5 m (row to row)
Sun Minimal Elevation: 0 °
Collector: (click to open choices)
Collector Selection#
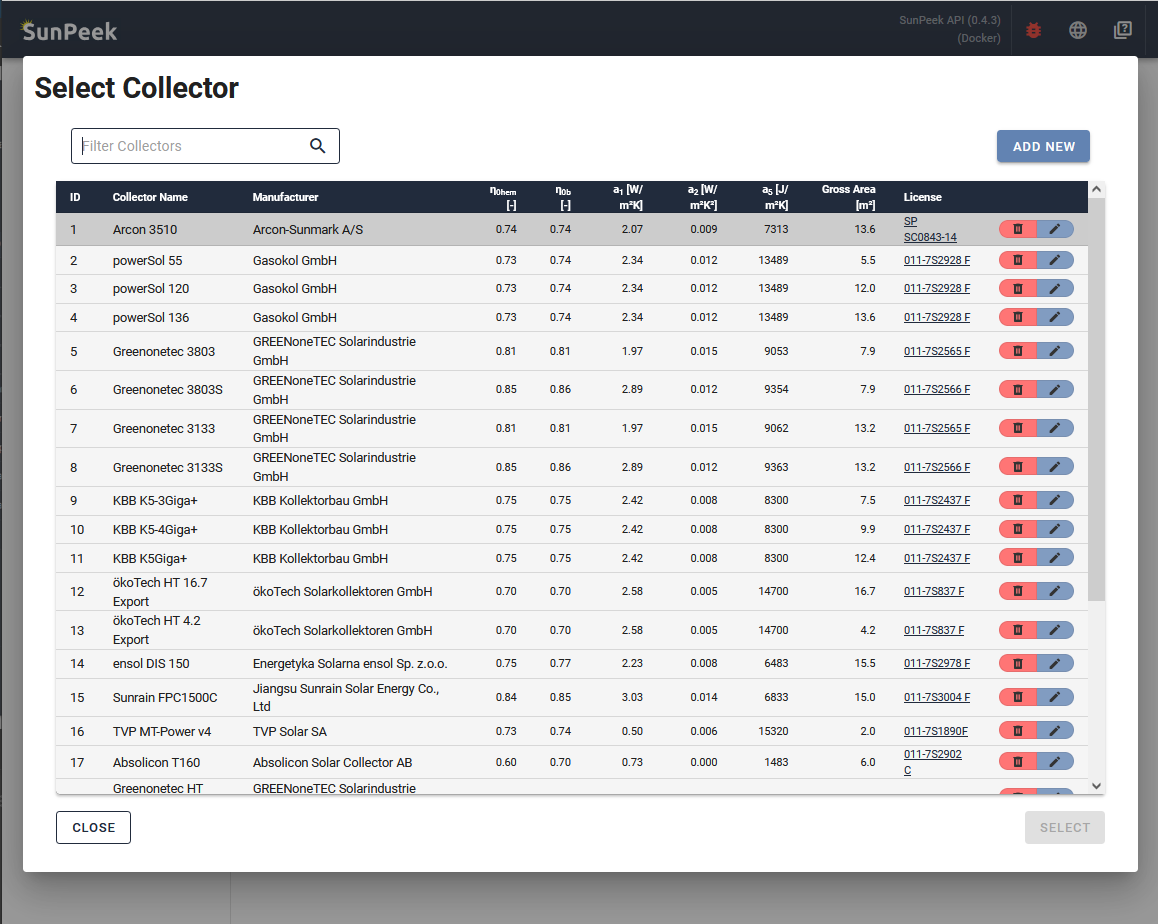
Clicking on the collector input field, the collector-type selection page opens. Here, user can select predefined collector-types with the respective Solar Keymark data. Click on an entry in the list, and then on the button SELECT at the bottom right to select the collector. As alternative, you can also double-click to select.
- In the case of the Demo-Plant:
we use the text-search on the top to select the Arcon 3510 collector type.
Custom Collectors
You can add a custom collector directly in the WebUI by clicking the ADD NEW button at the bottom of the collector selection list. This opens a form where you can enter all collector parameters from your Solar Keymark certificate.
For more details on collector parameters and how to define custom collectors (including programmatically via Python), see the Collectors documentation.
Confirm#
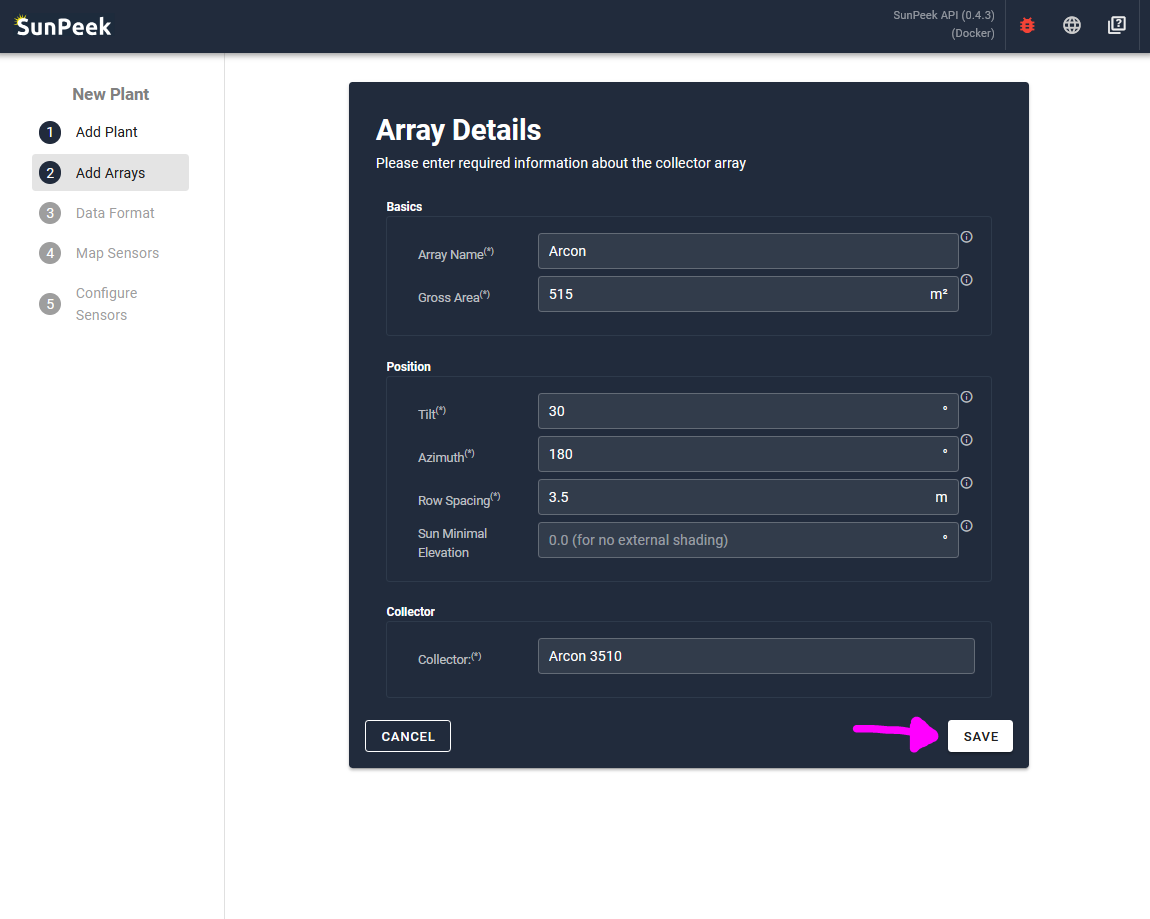
You are now back at the Array Details page, where you can save the array clicking on the SAVE button on the bottom right.
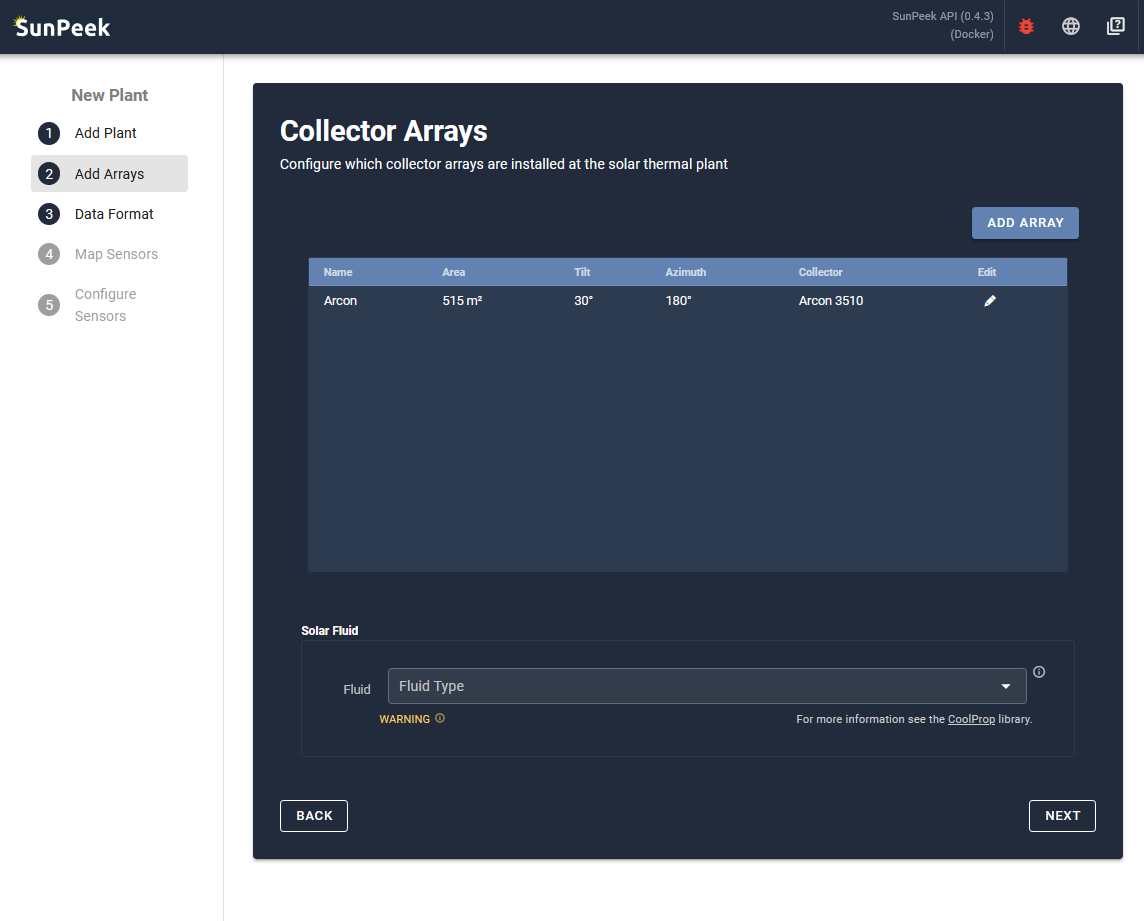
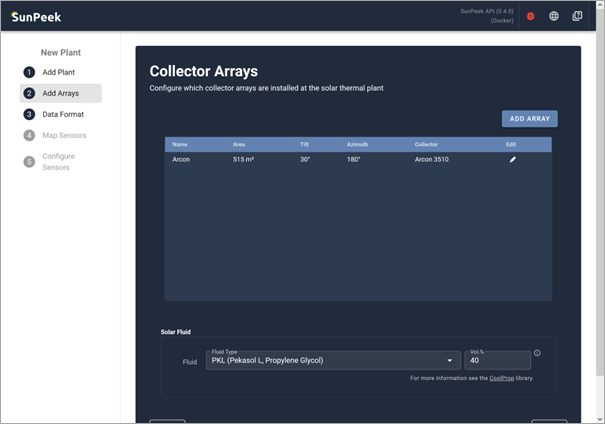
You will be redirected back to the main collector array configuration page. In case you have multiple subfields with different collector types (or orientation), you can add even more collectors. In the case of the Demo-Plant, only the ARCON collectors are included in the measurement data - so we don’t need to add another array.
Setting a Fluid#
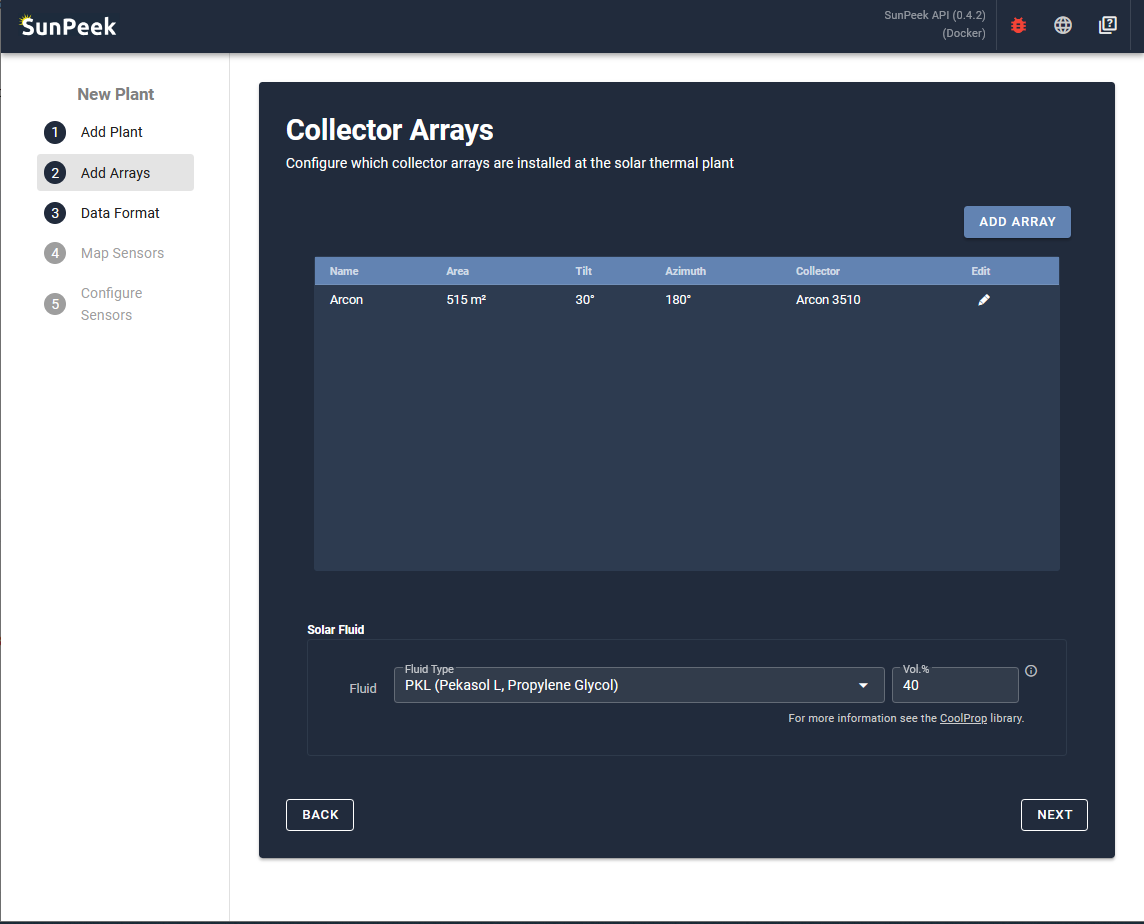
The input field in the lower part can be used to specify a fluid. However, this is only required if power is not directly measured - and only volume flow or mass flow sensors are available. In this case, the fluid properties are needed to correctly compute the measured power which is required for Power Check. To add a fluid, simply click in the input field, and select a fluid type. The properties of the fluids are then automatically extracted from the library coolprop.
- In the case of the Demo Plant:
let’s use Pekasol L
with a concentration ratio of 40%.
Note
In the official demo plant, a custom fluid called Pekasolar_FHW (Pekasolar fluid used in plant FHW, Pekasolar. Fixed concentration, as used in plant and lab-measured.) is used, which is an accurate, lab-tested description of the fluid used at FHW. However, the tutorial uses PKL as it represents a more common example. For more information on fluids, including how to add custom fluids, see Fluids.
Data Format#
This step allows users to specify the format of the measurement data that is uploaded to SunPeek. Only with this information, SunPeek can successfully interpret the measurement data and automate Power Check evaluation.
Specify Data Format#
This step allows you to specify the data format, so SunPeek can correctly read the measurement data. In order to make this as easy as possible, SunPeek tries to automatically detect the data format to the best of its abilities, or tries to give hints for the user.
To do so, it requires a example measurement-data file, which resembles how future data files of that plant may look like. For example, if you have your data in daily CSV files, you can just chose the most recent one and upload it - using it as example for all the other files.
Uploading an example file#
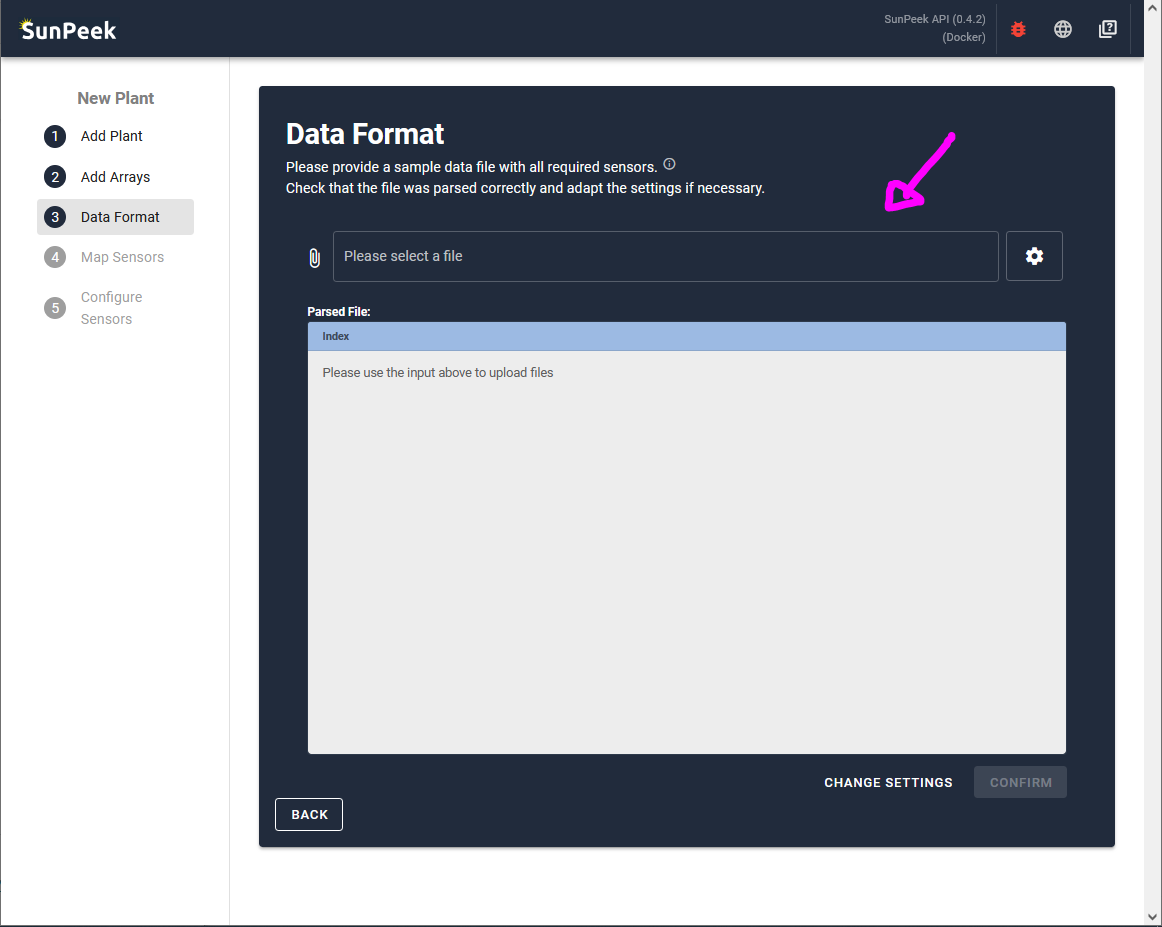
To upload the data, simply click on the input field, and select the file. You can also use drag-and-drop.
- In the case of the Demo plant:
we can simply use the public FHW data which is available here.
Parsing takes too long?
To improve the speed of the import, it might make sense to use a smaller file with only a few rows of data.
Adjust Settings#
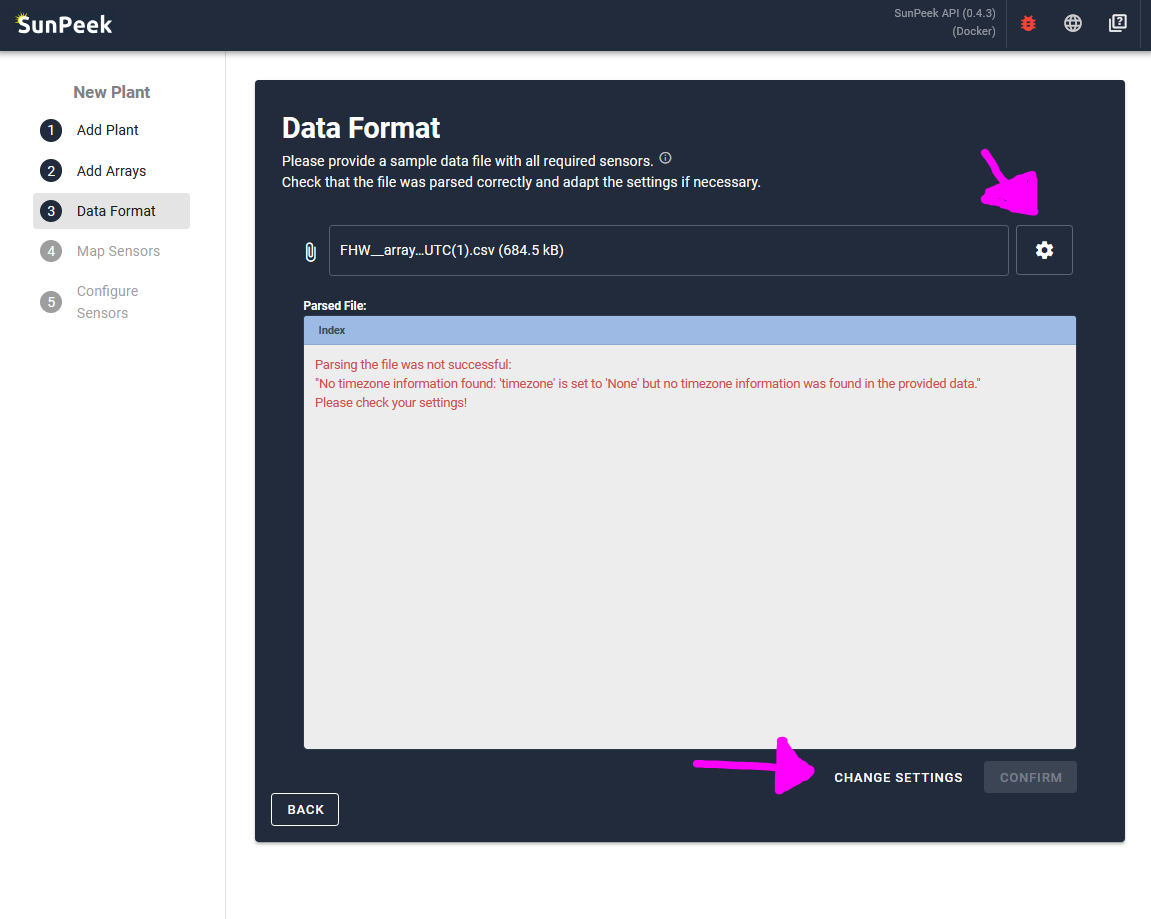
After a file has been selected and parsed, SunPeek might encounter an error.
With this page, you can adjust the settings so SunPeek can correctly parse the file.
To change any setting, you can click on the CHANGE SETTINGS button at the bottom of the screen,
or alternatively click on the cog symbol on the right of the file-input.
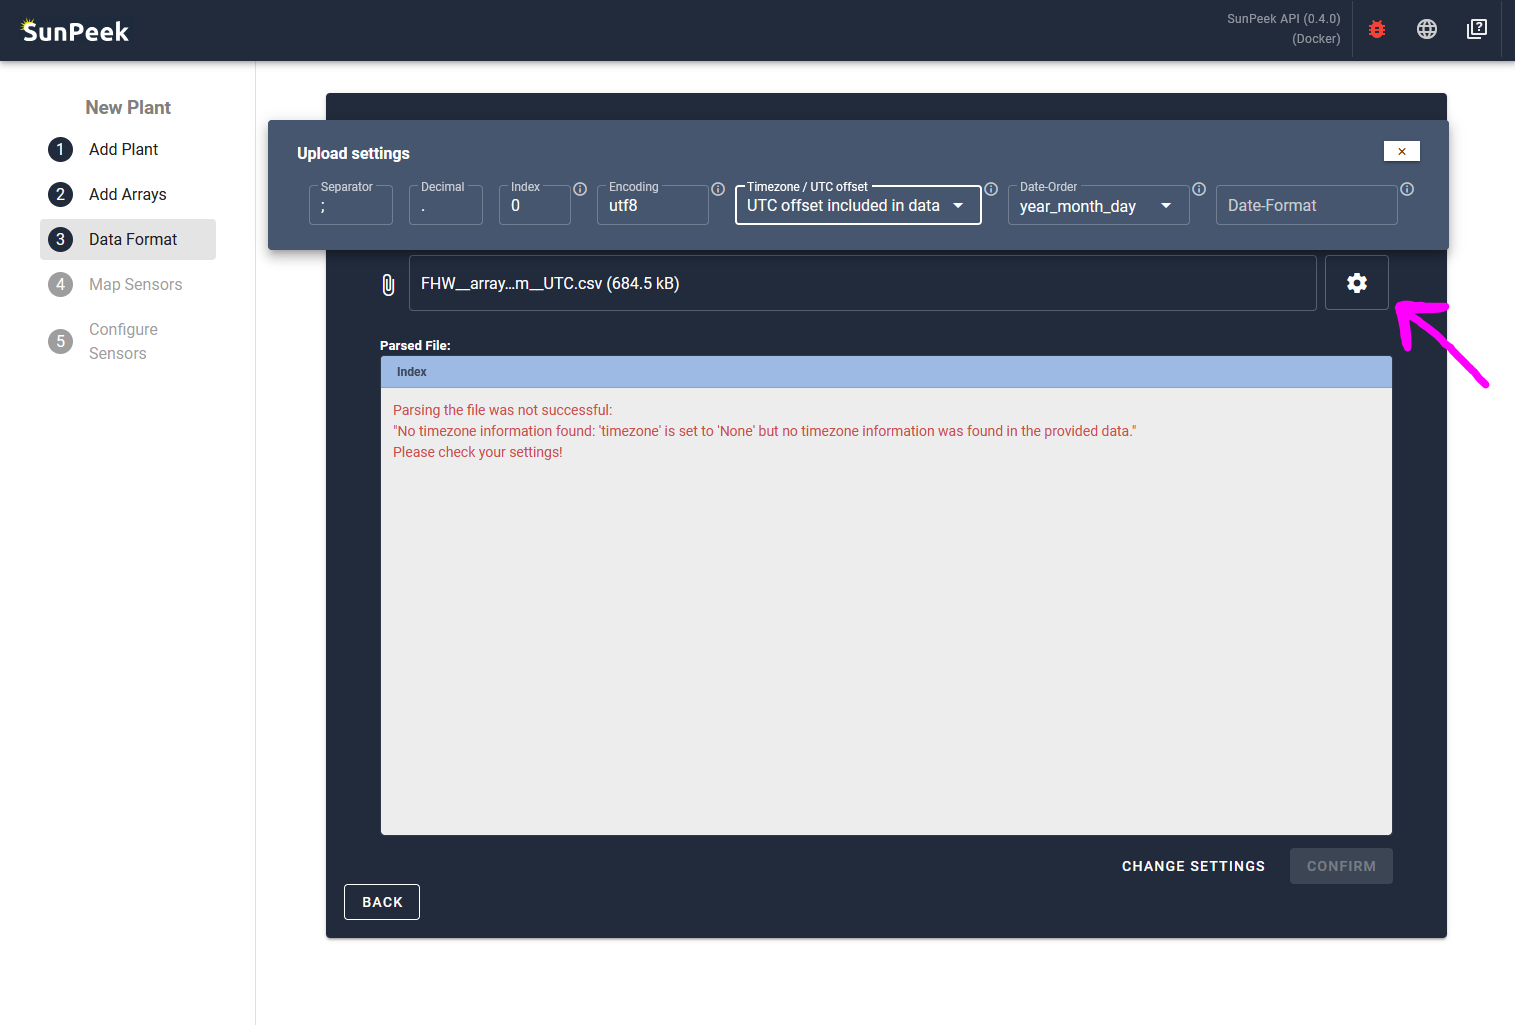
- On click, the settings open - showing the following options:
Separator: The symbol used for separating the columns. In the case of FHW, this is a semicolon, which is also the default.
Decimal: The symbol used for decimal places. Typically this is a dot “.” but in germany for example also often a comma “,”.
Index: The column number (starting with 0) where the column with the timestamps are located. In most cases, the timestamp can be found in the first column (index=0)
Encoding: Encoding used to display symbols. Typically, utf8 is used, while other encodings like latin1 are sometimes used as well to display Umlaute (äöü).
Timezone: The timezone of the timestamps within the data. This is critical so SunPeek can correctly compute the sun angles matching with the time in the measurement data.
Date-Order: SunPeek automatically tries to infer the timestamps to the best of its abilities. However, it sometimes needs to know whether month year or day come first (e.g., 01.02.2024 versus 2024/01/02)
Date-Format: If the Date-Order fails, the user can also input the specific date format using datetime-format codes (e.g., %y.%m.%d %H:%M).
- In the case of the Demo-Plant:
In the case of the FHW dataset, SunPeek complains about the timezone.
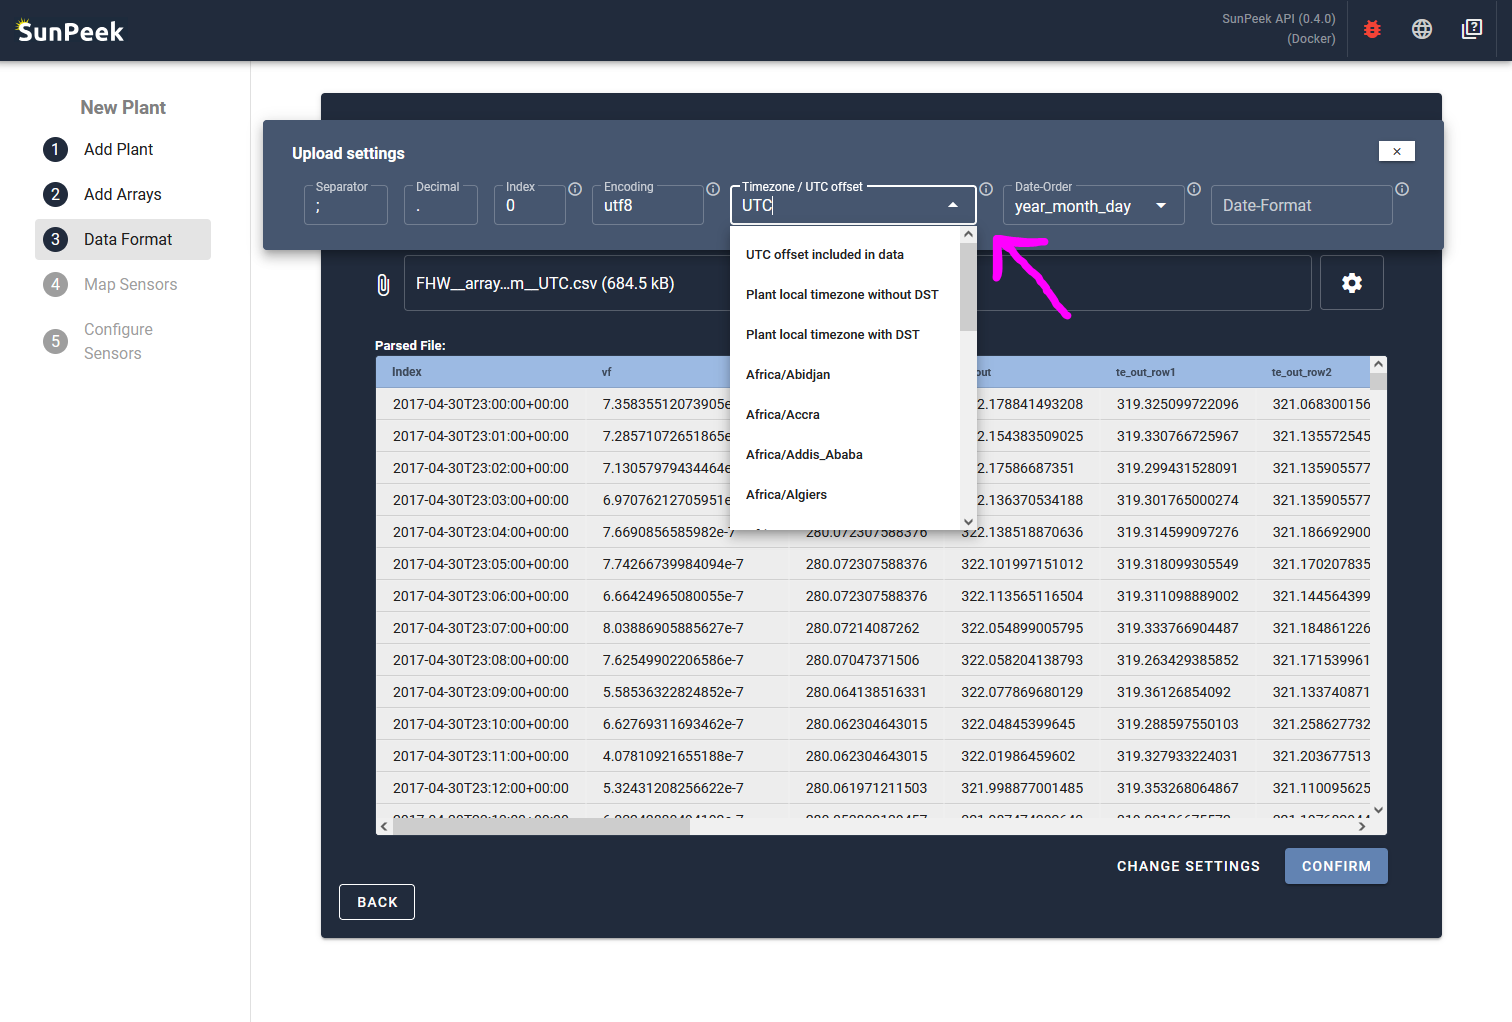
Looking at the measurement data (e.g. with Notepad++), we can see that no timezone information is included in the timestamp in the individual rows. However, the dataset name indicates that UTC (coordinated universal time) was used for logging the data.
Hence, we adjust the timezone setting to ‘UTC’
With this information, the data seems to be parsed correctly:
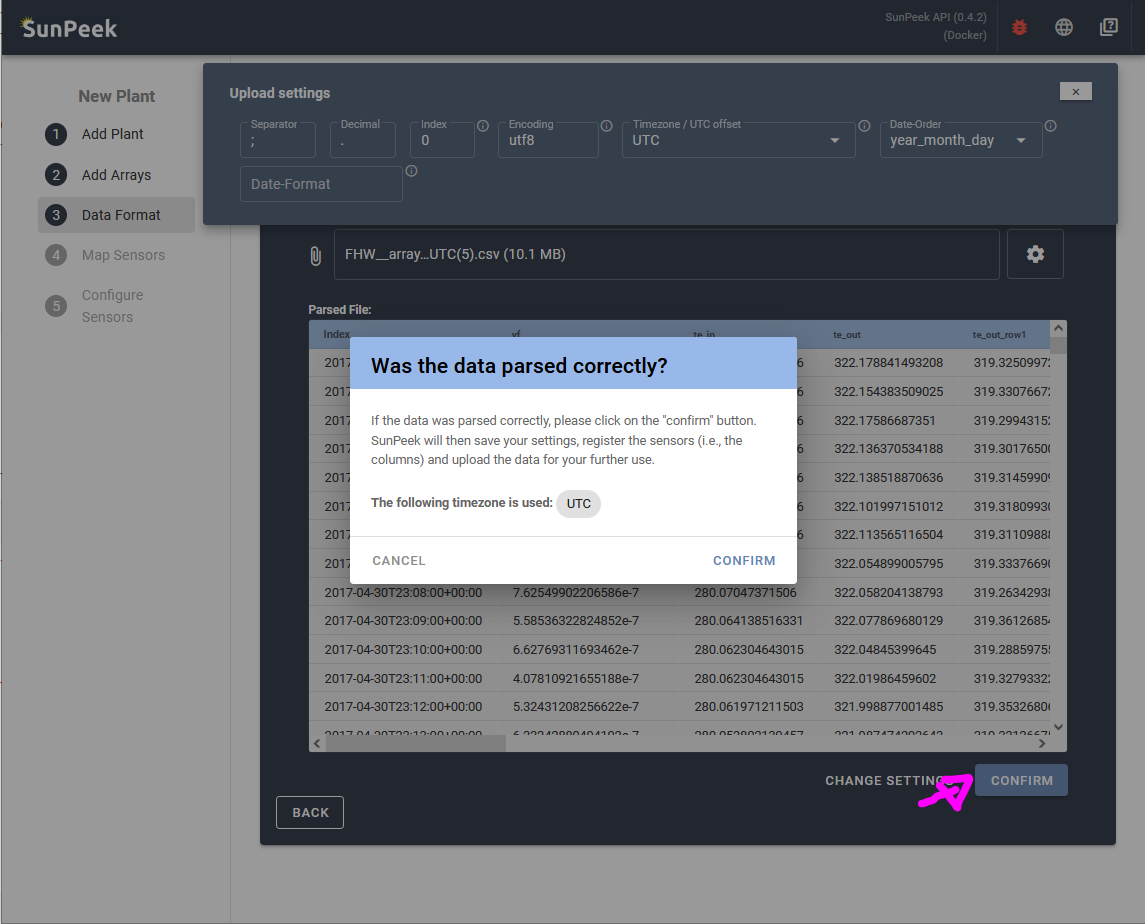
Confirm#
All that is left to do click on the CONFIRM button on the lower right. On click, a pop up appears to let the user confirm the timezone again.
Additional questions#
You may wonder what kind of files SunPeek accepts in general:
What file extensions are accepted?
SunPeek expects .CSV files, but also accepts .TXT, .DAT, or similar file extensions.
How should the files look like?
SunPeek expects typical CSV structure, consisting of columns (e.g., for each measured datapoint) and rows (with the corresponding values). You can think of it as a table. Columns and rows are indicated by a dedicated symbol (typically semicolons “;” for columns and line breaks “\n” for rows). You can open the example FHW file to see how this looks.
How should the columns be named?
SunPeek expects datapoint names to be in the first row. However, it does not require any specific naming schema. The Sensor Mapping allows you to link datapoint names to the corresponding SunPeek data channels.
What measurements should be included?
You can include any datapoint in the data. However, all sensors required for Power Check should be present to run the analysis. For more info, see Sensor Mapping. The required sensors may differ depending on your setup.
See also
If you encounter errors during data upload or parsing, see Troubleshooting for common issues and solutions.
Sensor Mapping#
The next step is the sensor mapping. It makes sure that SunPeek can understand the measurement data. More specifically, it maps the datapoint names inside the measurement data to the sensor-channels that SunPeek uses to compute virtual sensors and perform Power Check.
See also
For a detailed explanation of sensor mapping concepts—including required vs optional slots, virtual sensors, and calculation dependencies—see Sensor Mapping.
General idea#
As shown in the following picture, the main idea is to map the sensors (included in the measurement data) to the SunPeek channels. In the depicted case (which matches the demo plant), we have a setup with only one collector array and the heat measurement in the primary circuit - using a flow sensor and flow and return temperatures. (see also ISO 24194 and Guide to ISO 24194 for more information on required sensors).
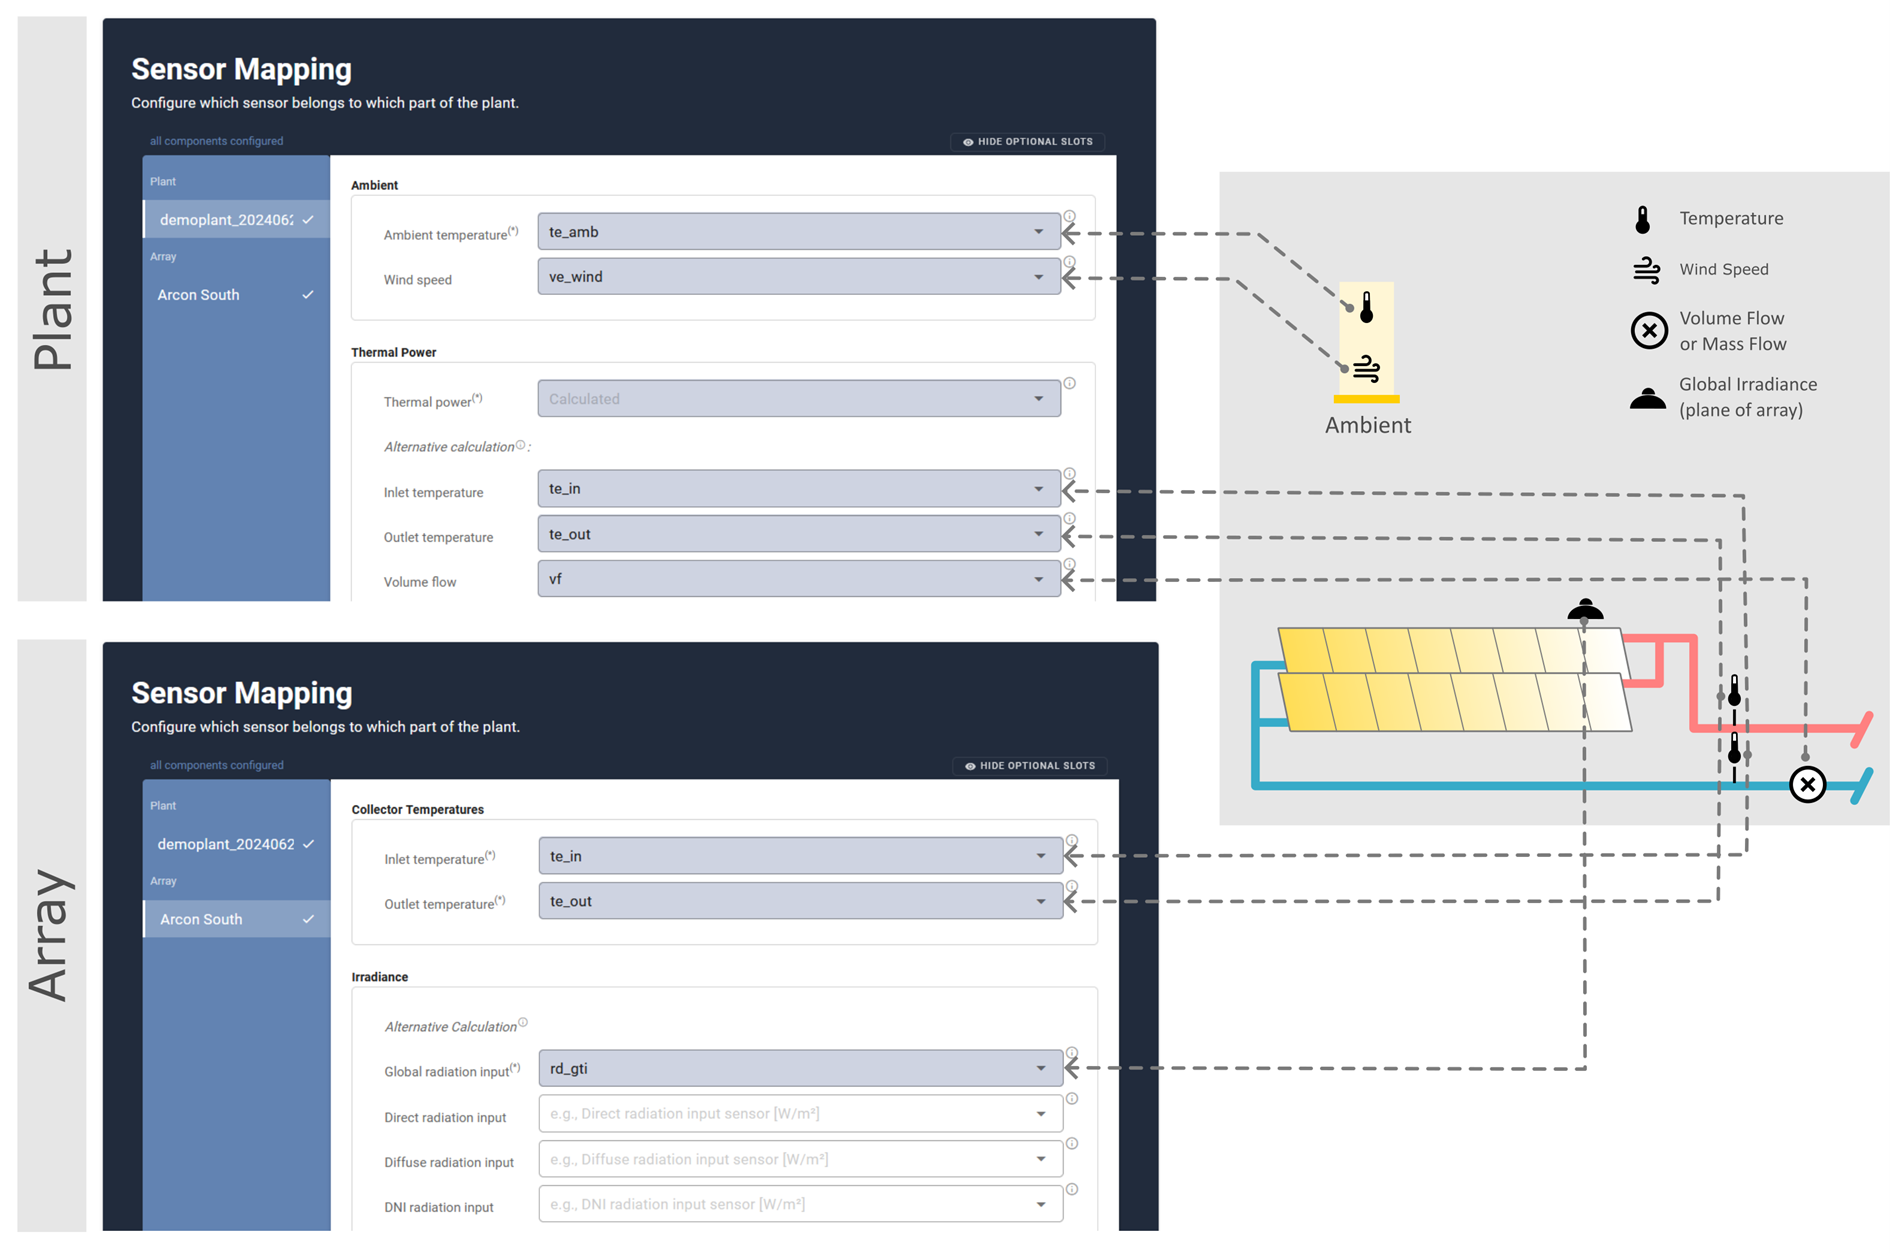
The mapping is done by selecting the correct sensor name from the dropdown (which is generated based on the measurement data) This is how the sensor mapping looks like
- Note that the screen is split into two sections:
components are shown on the left side (blue background). Each component corresponds to one part of the plant. There is always one component for the plant level and one or more components for the array level (depending on how many collectors you added in the Array configuration)
sensor slots that are available for each component are shown on the right side (white background). Note that different types of components can have different slots (but all components of the same type have the same slots).
- Note that some of the sensor channels are optional:
In some cases assigning sensors might allow you to compute virtual sensors - for example, thermal power based on flow and temperatures.
In other cases, additional sensors might lead to a increased accuracy of Power Check results - for example, if wind speed is measured.
In other cases, additional sensor might lead to different insights - for example, if thermal power is available for collectors, the expected vs estimated ration can be checked also on collector level.
Tip
Optional channels can be hidden by clicking on the HIDE OPTIONAL SLOTS button on the upper right. See Figure below
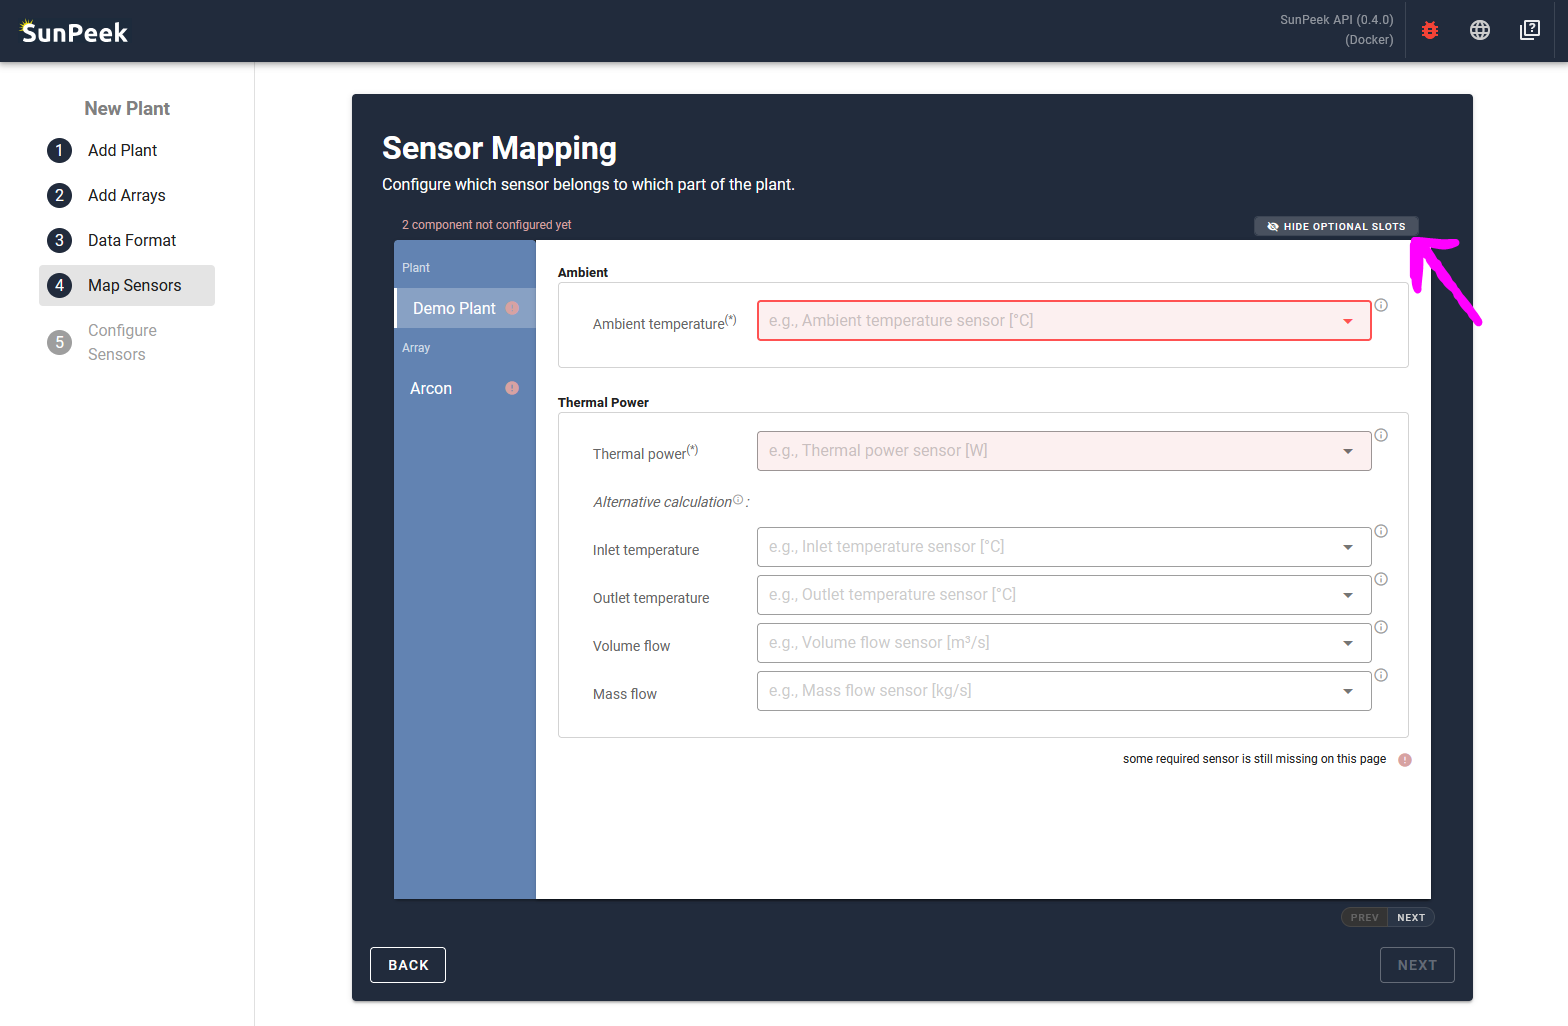
Note
Some slots may still appear when “Hide Optional Slots” is enabled because they are setup-dependent—required for your specific plant configuration. For example, Volume Flow appears if thermal power needs to be calculated rather than measured directly. See “Hide Optional Slots” Toggle for details.
Mapping: Plant sensors#
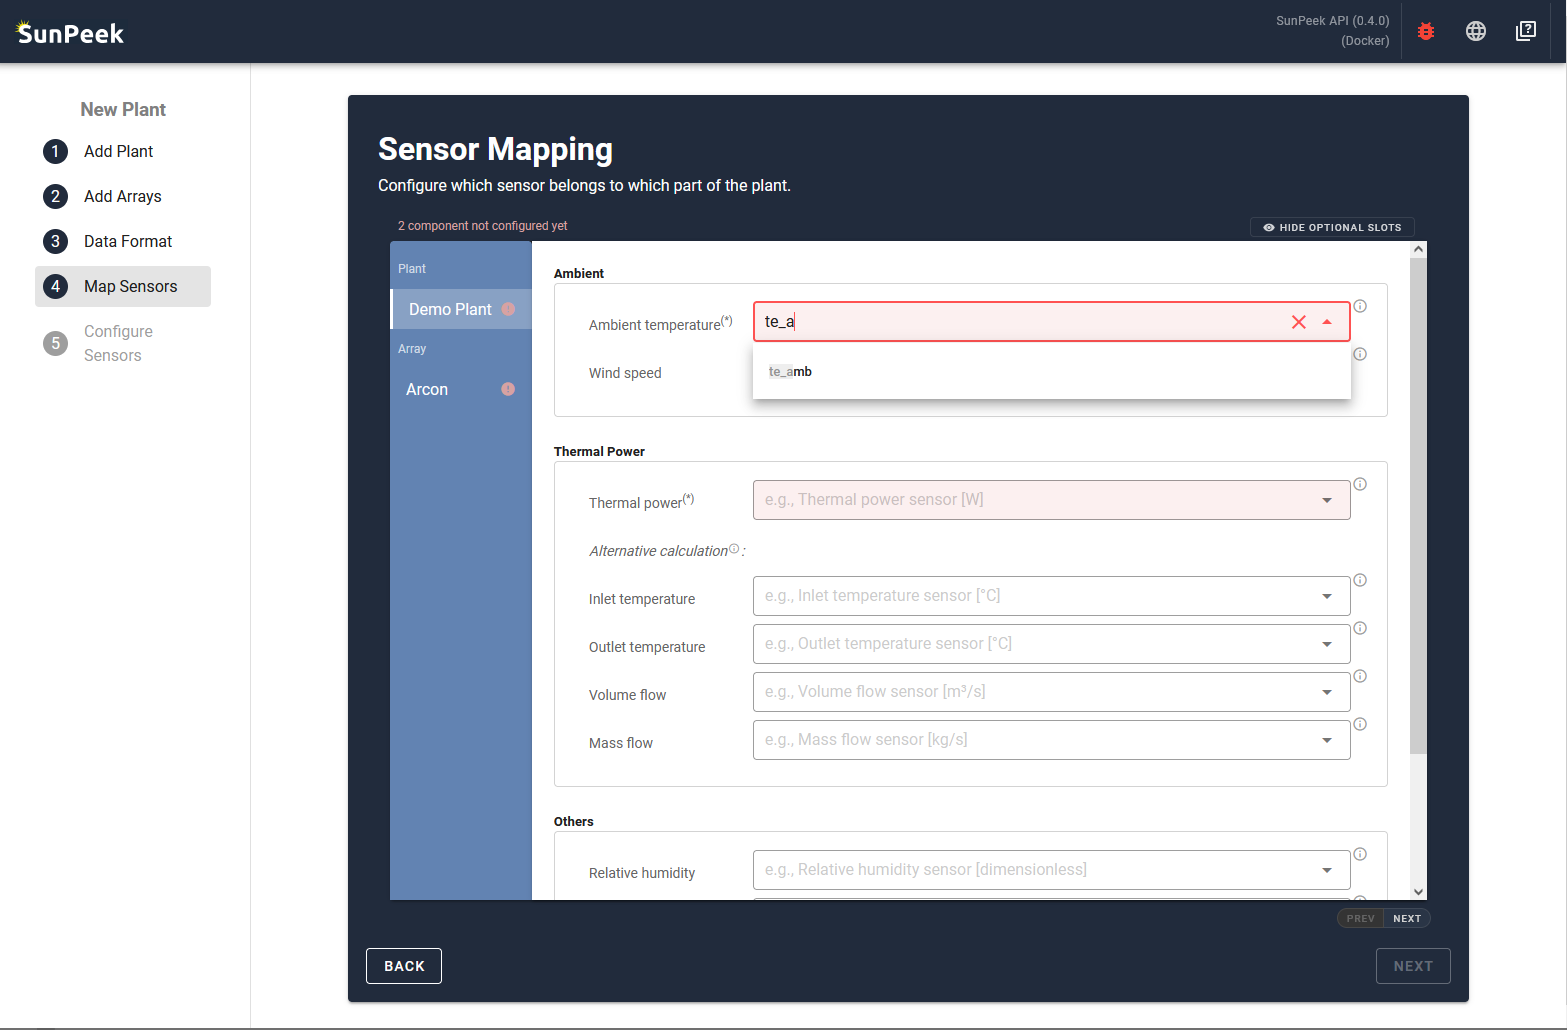
The plant part allows to map sensors that are related to the overall plant. For example, this includes ambient information such as ambient temperature, but also an overall measured thermal power to perform Power Check.
To assign sensor names from the measurement data to the channels, simply click on a input field and select the correct sensor (you can also filter by typing in the name). If you are unsure about the meaning of the sensor slot, please check out the tooltip by hovering over the information symbol at the outer right of each slot.
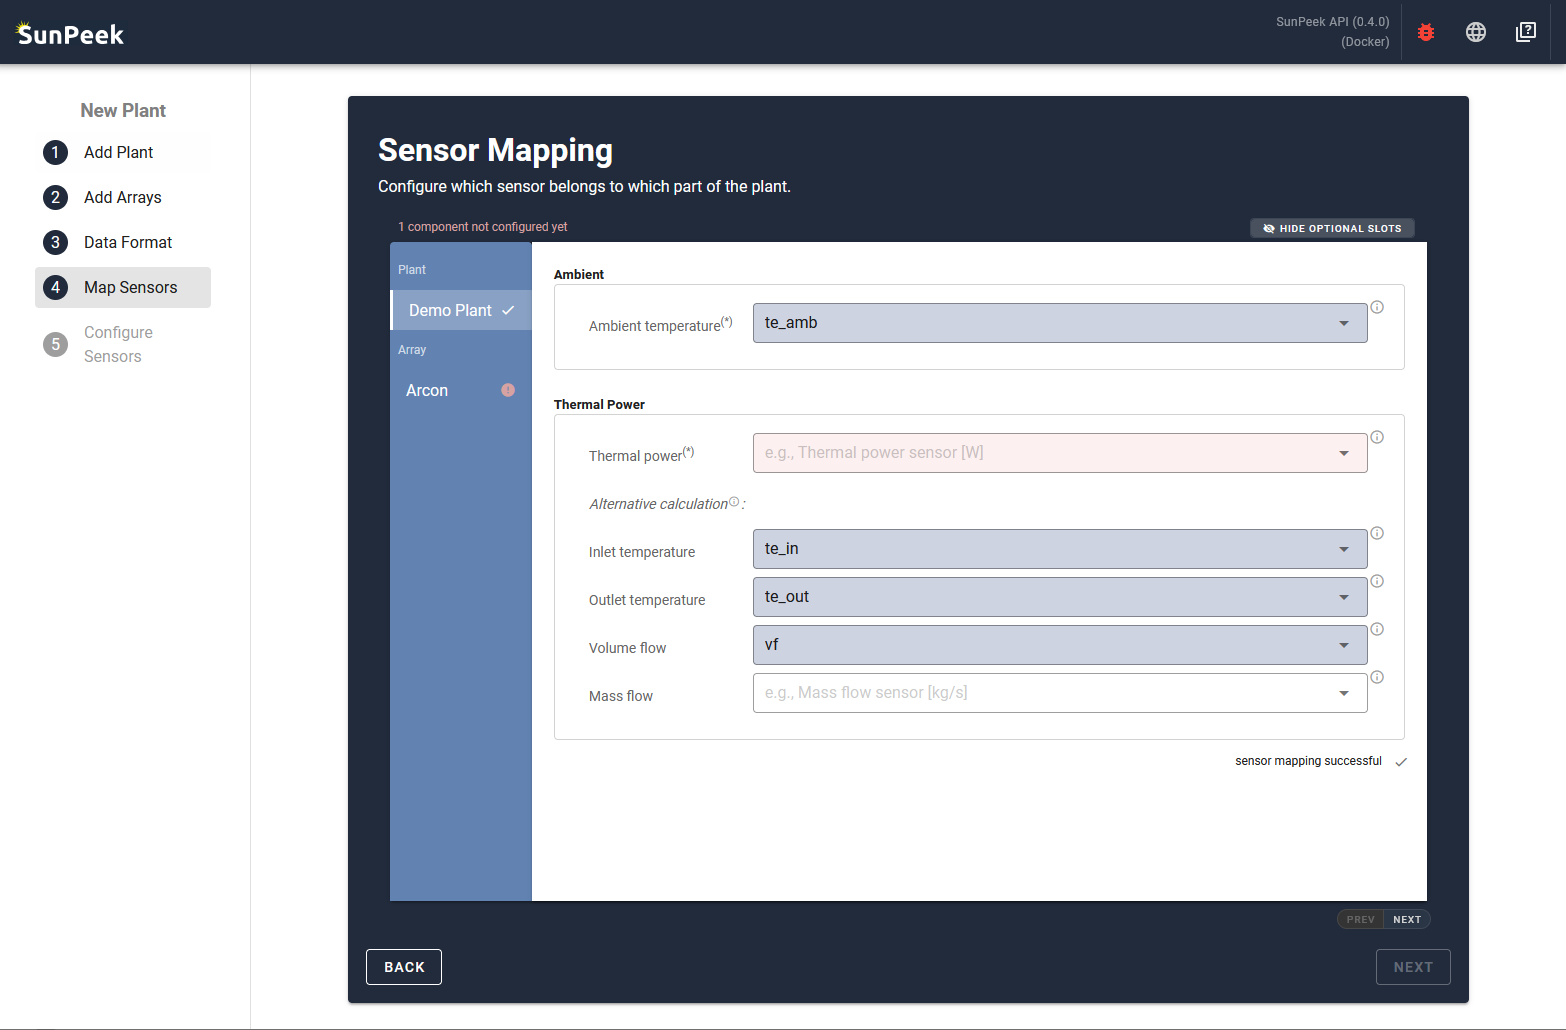
- In the case of the demo plant:
Ambient temperature: te_amb
Inlet temperature: te_in
Outlet temperature: te_out
Volume flow: vf
Note that the required thermal power is computed based on flow and return temperature and volume flow.
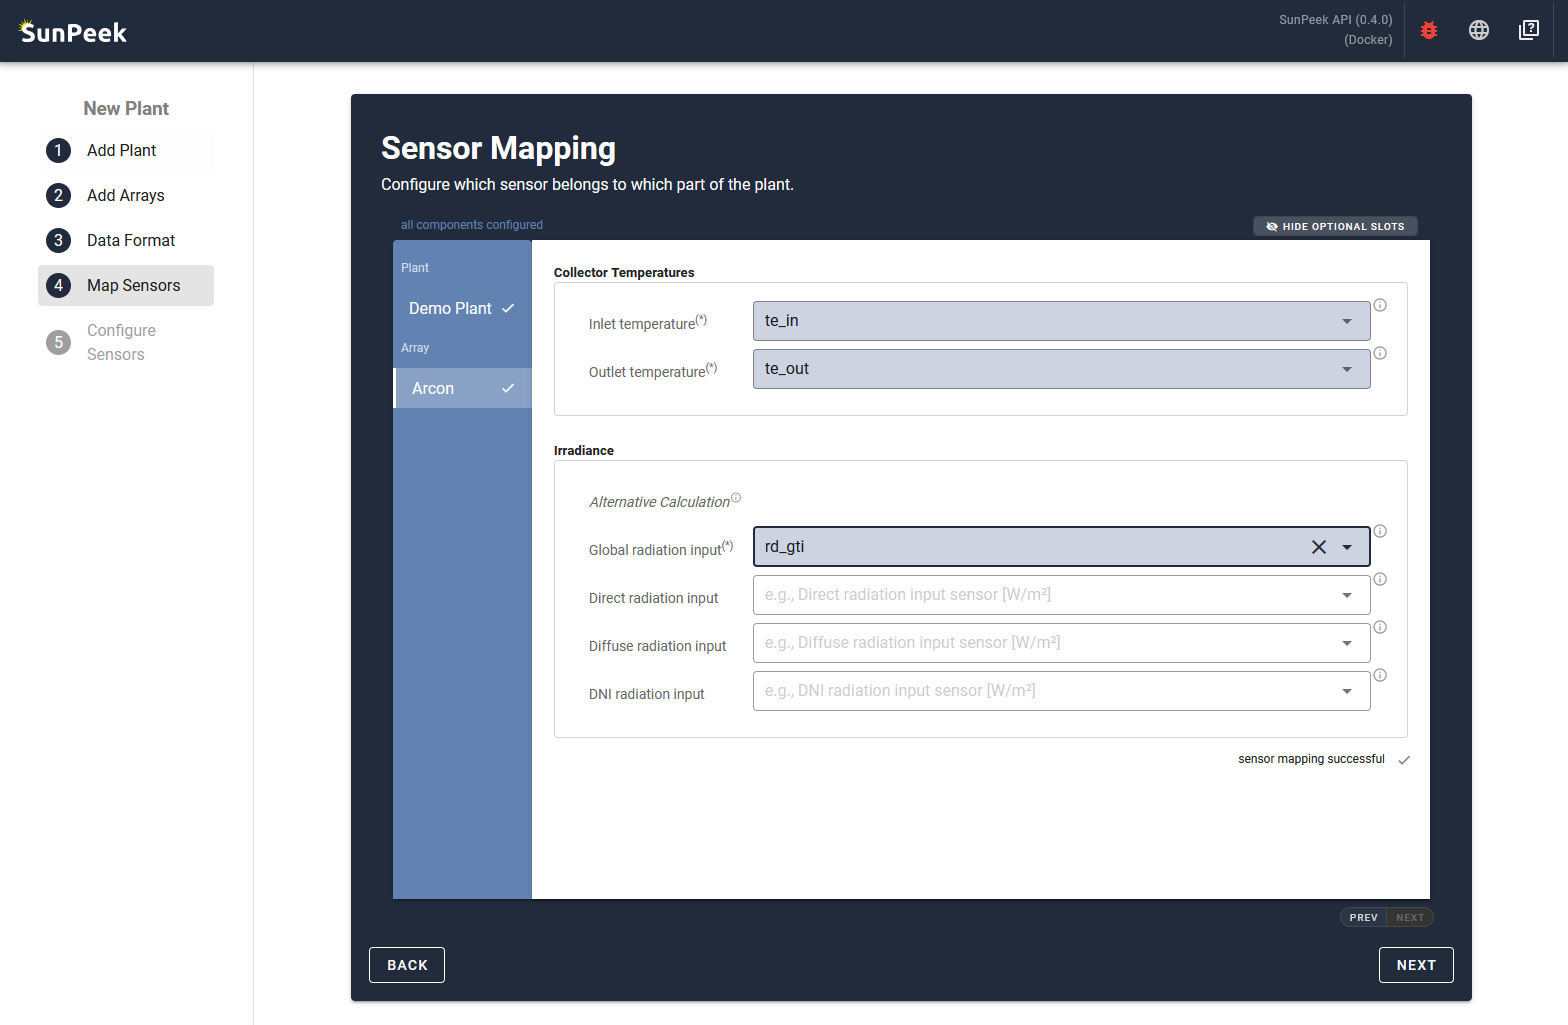
Mapping: Array sensors#
The array part allows to map sensors that are related to the collector fields, as defined in the steps before. For example, this includes information on the irradiance on the specific collectors, the temperature of the collectors, and (optionally) the power output.
To get to this section, you can either click on the NEXT button on the lower right of the screen, or click on the corresponding section on the left side of the page.
- In the case of the demo plant:
Inlet temperature: te_in
Outlet temperature: te_out
Global radiation input: rd_gti
Note that we only used the absolutely required channels in this demo. However, the demo plant data also contains additional sensors which could be mapped as well to increase the accuracy of the results and enables other formulas of the ISO 24194.
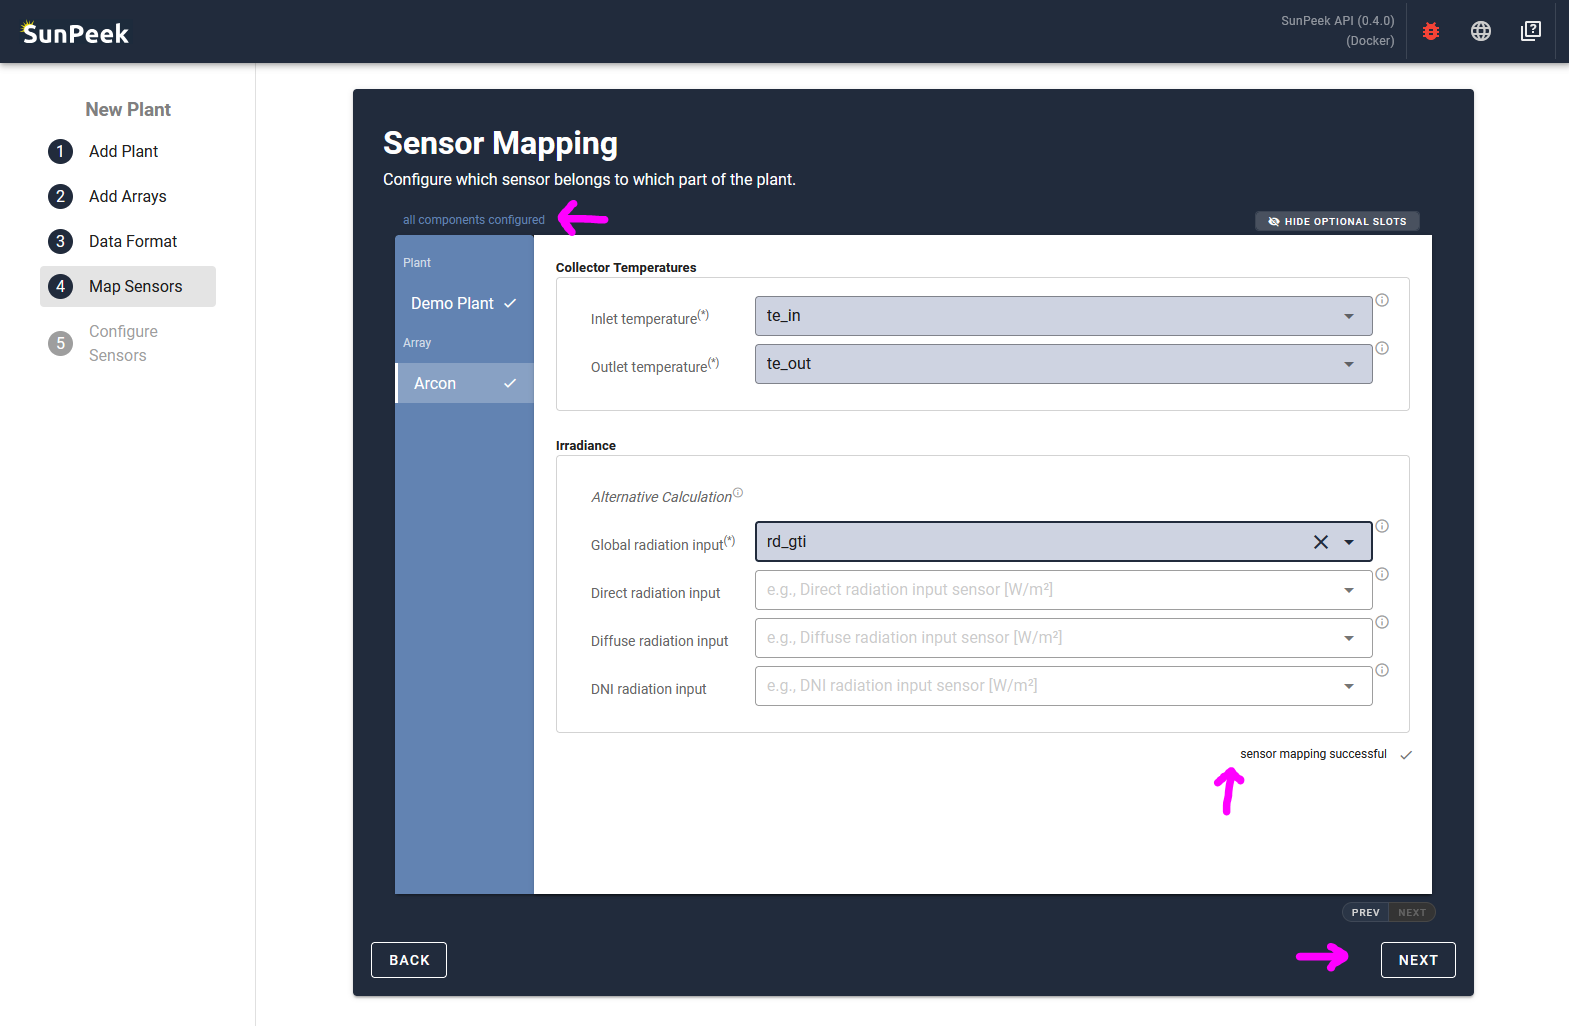
Confirm#
If all required slots are assigned for all components (as shown by different status indicators) you can continue by clicking on the NEXT button.
Sensor Details#
This page covers the sensor details. It allows you to specify the unit of measurement for each sensor and to add required meta-information to some special sensors (e.g. orientation is needed for tilted irradiance sensors).
Overview#
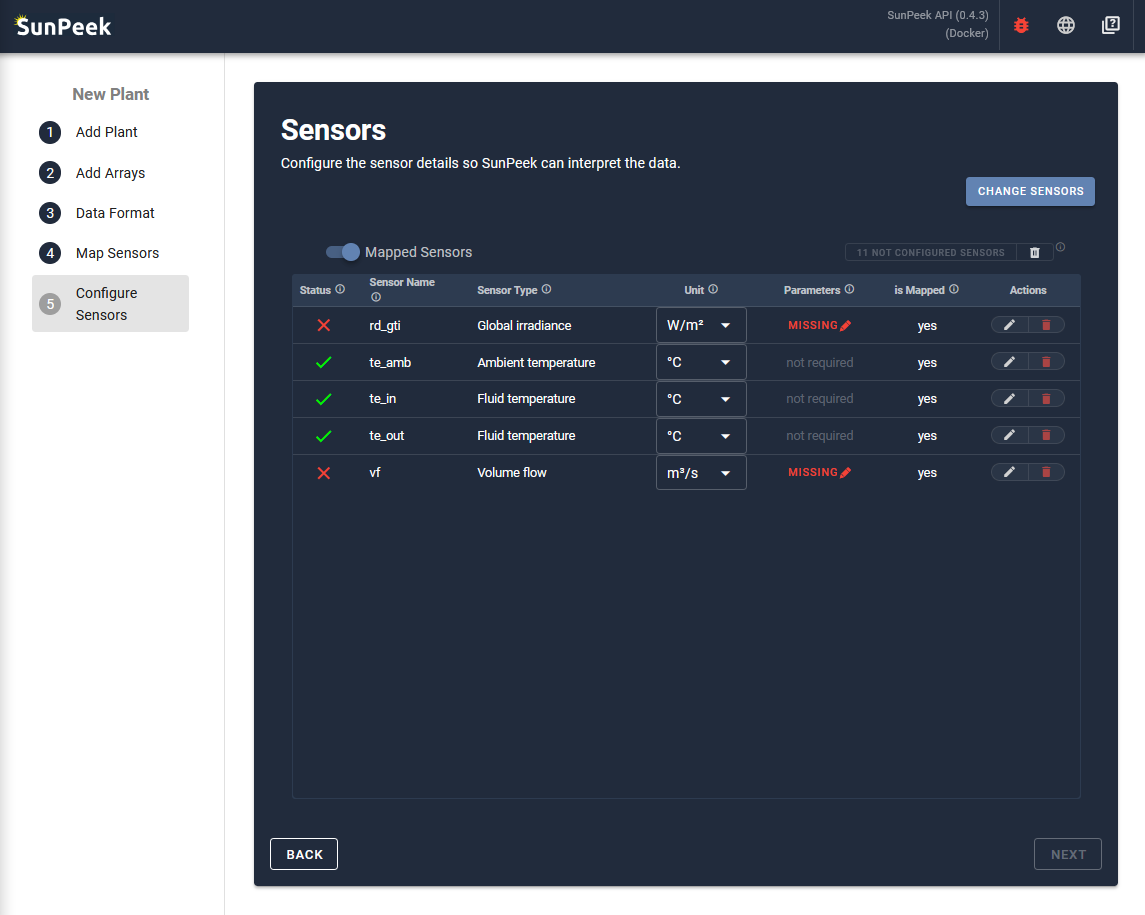
The page displays all the sensors of the current plant that are known to SunPeek as a list. For each sensor, it allows to check and adjust additional parameters that are required for SunPeek:
The first column shows the Status of the sensor
green. The sensor has all the information needed to interpret the data.
red. The sensor is missing some required information to interpret the data AND the sensor is mapped.
gray. The sensor is missing some optional information, but is currently not needed for SunPeek (Data will still be stored).
The second column shows the Sensor Name as it appears in the CSV data that was provided during sensor registration in the Data Format step.
The third column shows the Sensor Type that is used within SunPeek. Note that the sensor type is automatically set in case the sensor is already mapped to a component. Hence, the sensor type can only be chosen for sensors that are not assigned to SunPeek yet.
The fourth column shows the Unit of measurements. It is only available if the Sensor Type was already selected. Based on the sensor type, potential units are automatically provided as a dropdown list.
Some sensor types require additional parameters that are needed so SunPeek can fully interpret the data from the sensors (e.g. orientation of irradiance sensor). Hence this column allows to enter the information if you click on the “Missing” button (if the information is missing) or the “Edit” button (if the information is already set).
Finally, the sixth column shows the binary information whether the sensor is used in the sensor mapping or not.
Hint
By default, only the mapped sensors are shown, as only mapped sensors are actually used by SunPeek. If a user wants to see and adapt also other sensors (which is optional) the user can click on the “Mapped Sensor” toggle on top of the list to display all sensors.
Checking the Units#
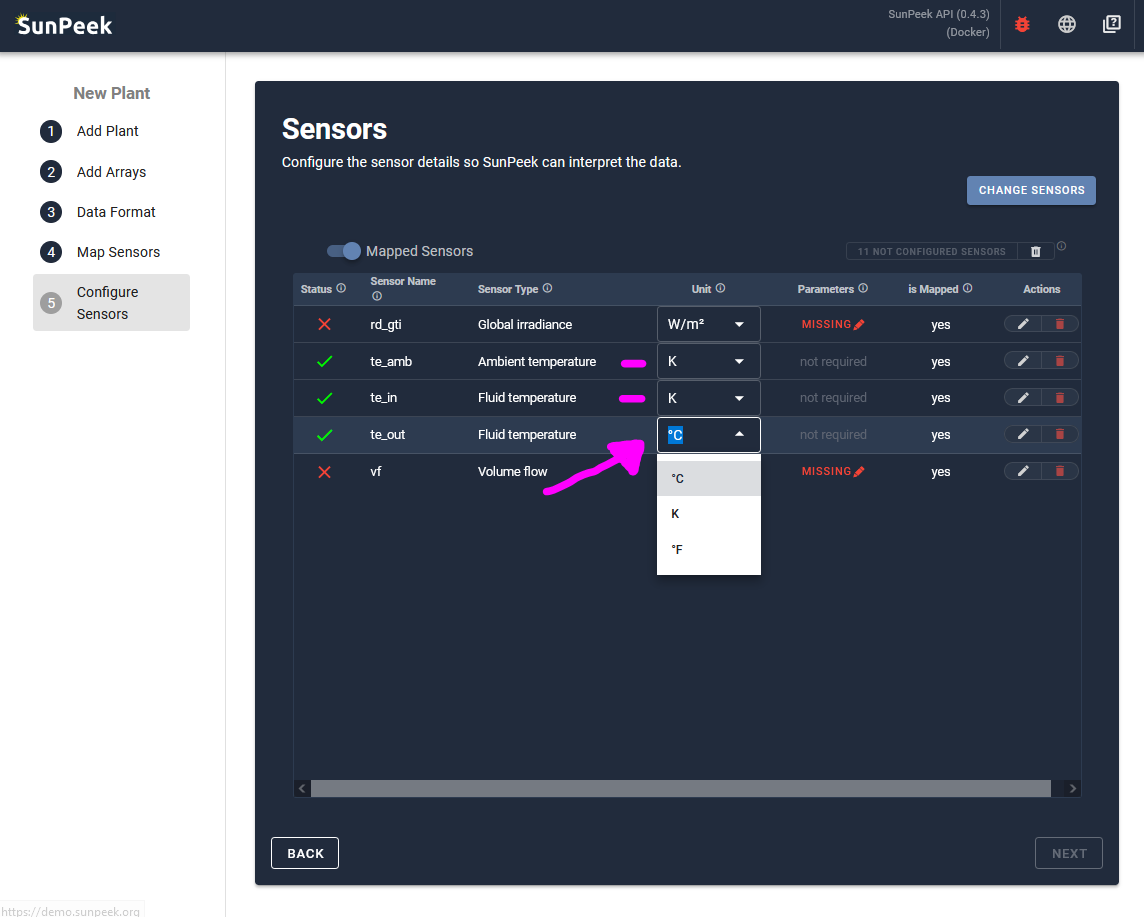
In a first step during the configuration of the plant, it makes sense to check the unit of the sensors for all the mapped sensors.
- In the case of the demo plant:
Irradiance is recorded in W/m² which matches the SunPeek default.
Volume flow is recorded in m³/s which matches the SunPeek default.
Temperatures are recorded in Kelvin - however, SunPeek uses degree Celsius by default.
Hence, we change this by clicking in the individual dropdowns and selecting: K
Missing Parameters#
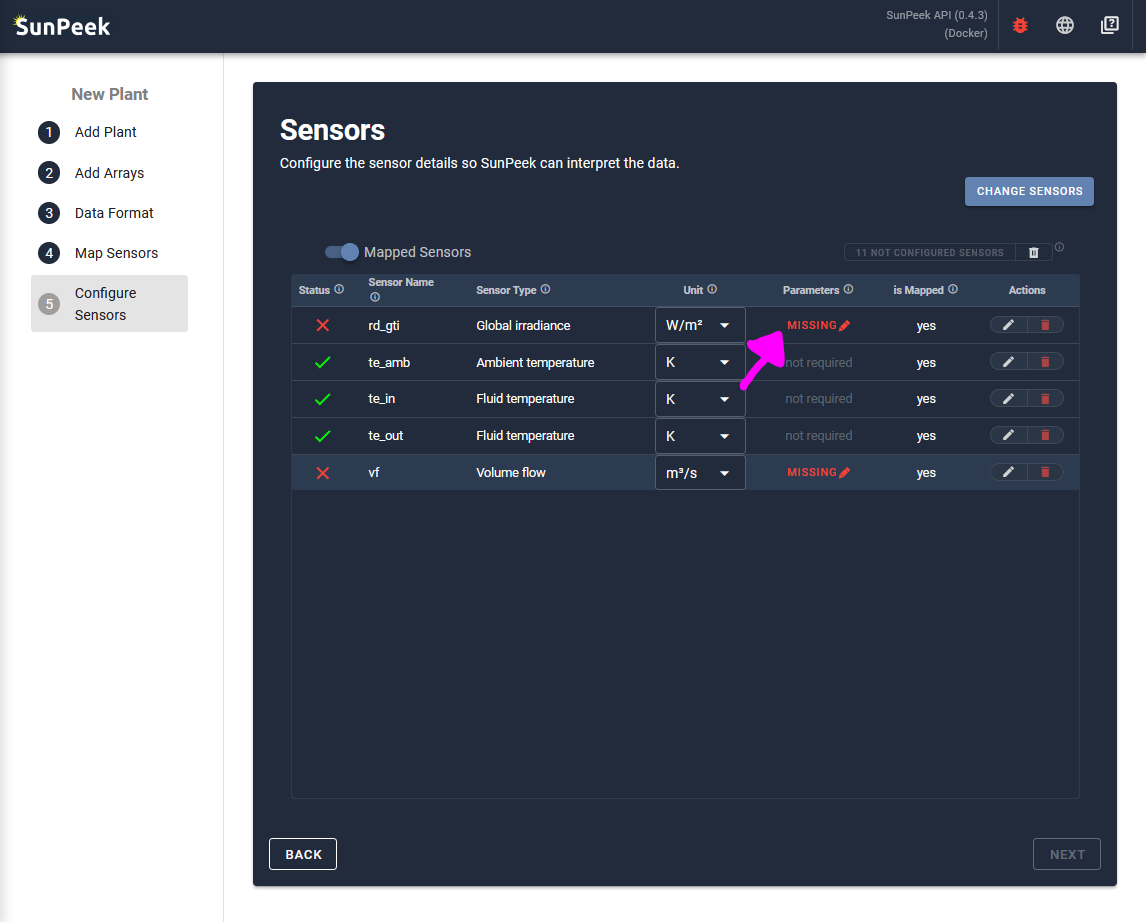
Some parameters might show a “MISSING” message in red in the Parameters column. In this case, parameters can be set by clicking on the missing message to open the Sensor Editor.
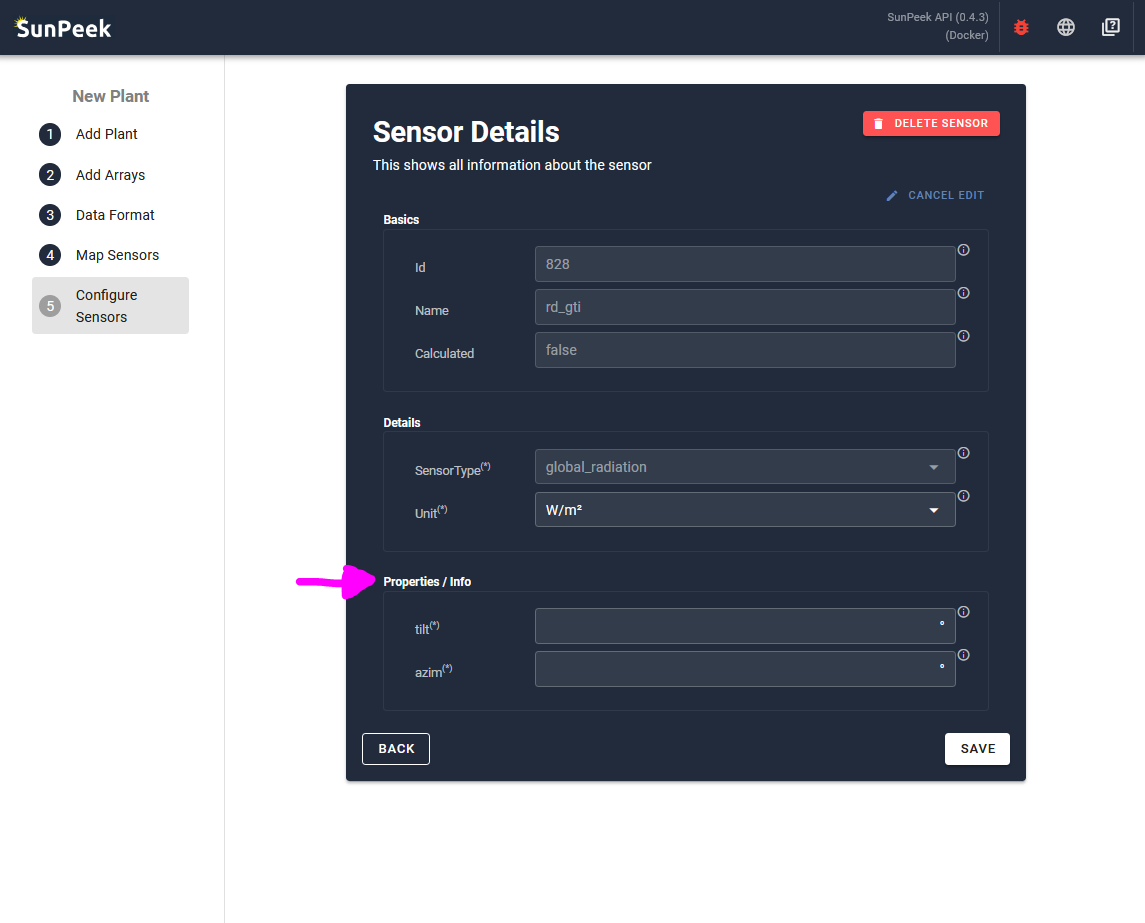
On this page, all information regarding a sensor are displayed:
ID: The internal ID of the sensor (fixed).
Name: The name of the sensor according to the data uploaded
Calculated: A boolean value indicating whether the sensor is calculated or recorded (fixed).
Sensor Type: the sensor type of the sensor. (fixed if sensor is mapped).
Unit: The unit of the sensor
Properties / Info: Additional parameters for the specific type of sensor. The inputs in the section are hence different for each sensor type.
Hence, this input form allows to change the parameters (also called properties or info) for the selected sensor.
- In the case of the demo plant:
We want to assign the following parameters to the sensors
rd_gti:
tilt: 30° (tilt of the sensor)
azim: 180° (orientation of the sensor. = south)
vf:
position: 0 (position of the sensor in flow or return. = in return)
Confirm#
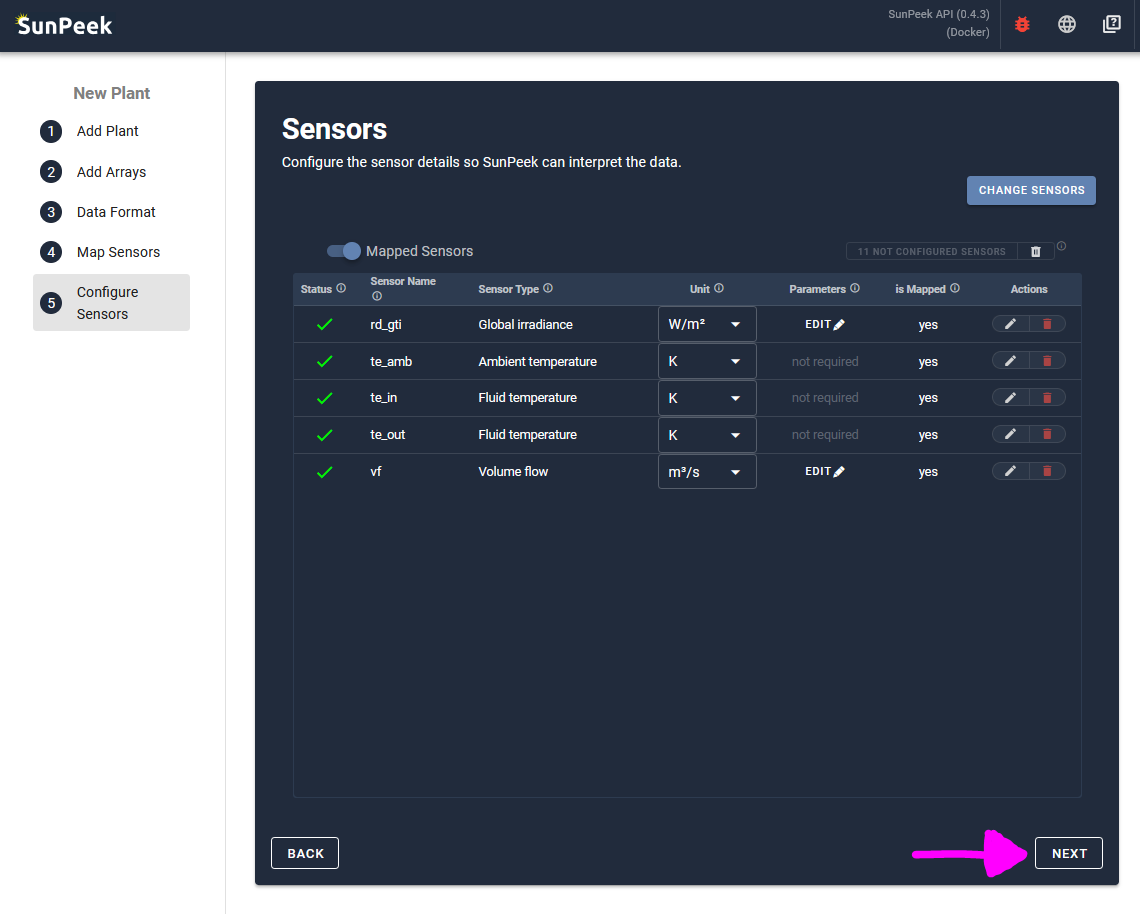
After checking the units and assigning all parameters to the required sensors, the NEXT button can be clicked to finish the plant configuration.
Note
There is also a button on the upper right to Delete all not configured sensors
This allows you to delete sensors, which are currently not used by SunPeek. This will increase the speed of parsing data as the deleted sensors will not be parsed. However, it also means that all the data needs to be imported again in case the deleted sensor is needed at a later time.