Sensor Data#
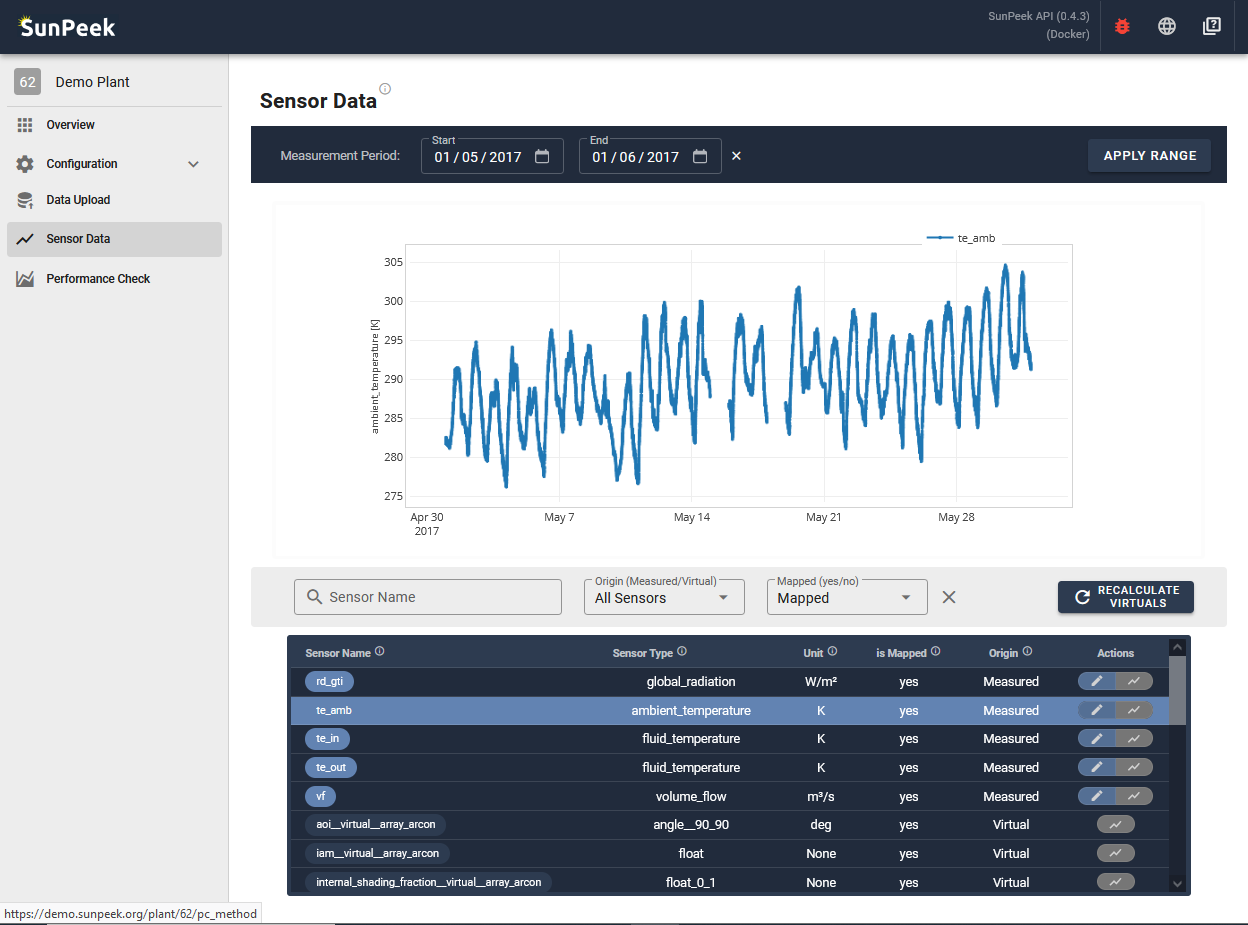
The Sensor Data page allows user to inspect the data that was uploaded to SunPeek. It can provide a quick check if the sensors were parsed correctly by displaying the measurement values. In addition to the measured sensors it can also show the values of the calculated virtual sensors.
Overview#
The page consists of the main sections:
Sensor Selection
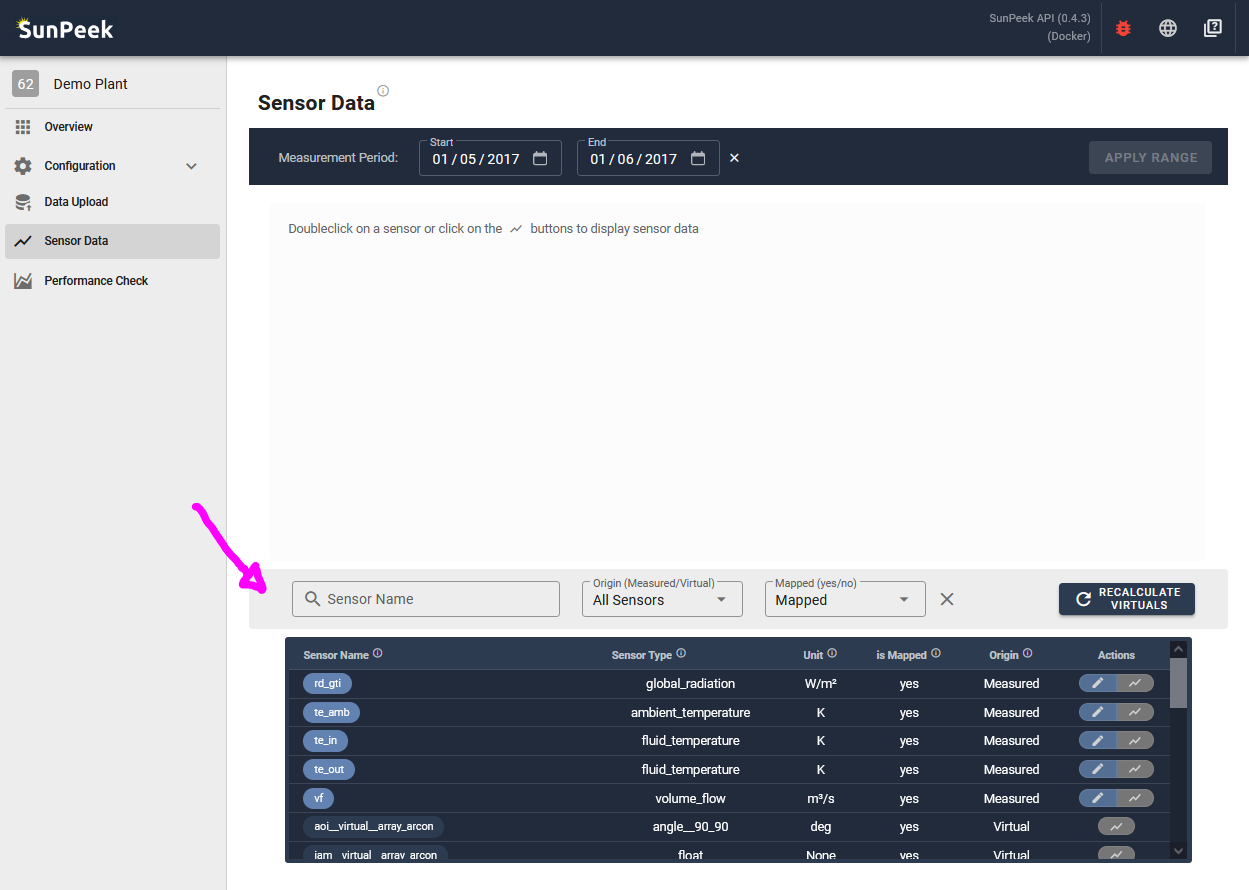
The lower half of the screen shows a list of all sensors that are known to SunPeek. In addition, it also contains virtual sensor - which are sensors that are not provided with the measured data via the data upload, but are calculated inside SunPeek. For each of the sensors, the name, sensor_type, unit and some other information is displayed in the list. A user can use the Actions at the right of each sensor, to edit the sensor information (pencil symbol), or to display the data (line chart symbol). Alternatively, double-clicking on a sensor also shows the measurement data.
A toolbar on the top of the list allows to filter the sensors shown below. User can either search by name, toggle between virtual or measured sensors, or filter to only show sensors that are mapped within SunPeek.
In addition, the Recalculate Virtuals button allows to redo the calculation of virtual sensors (which is normally done after uploading data)
Sensor Values
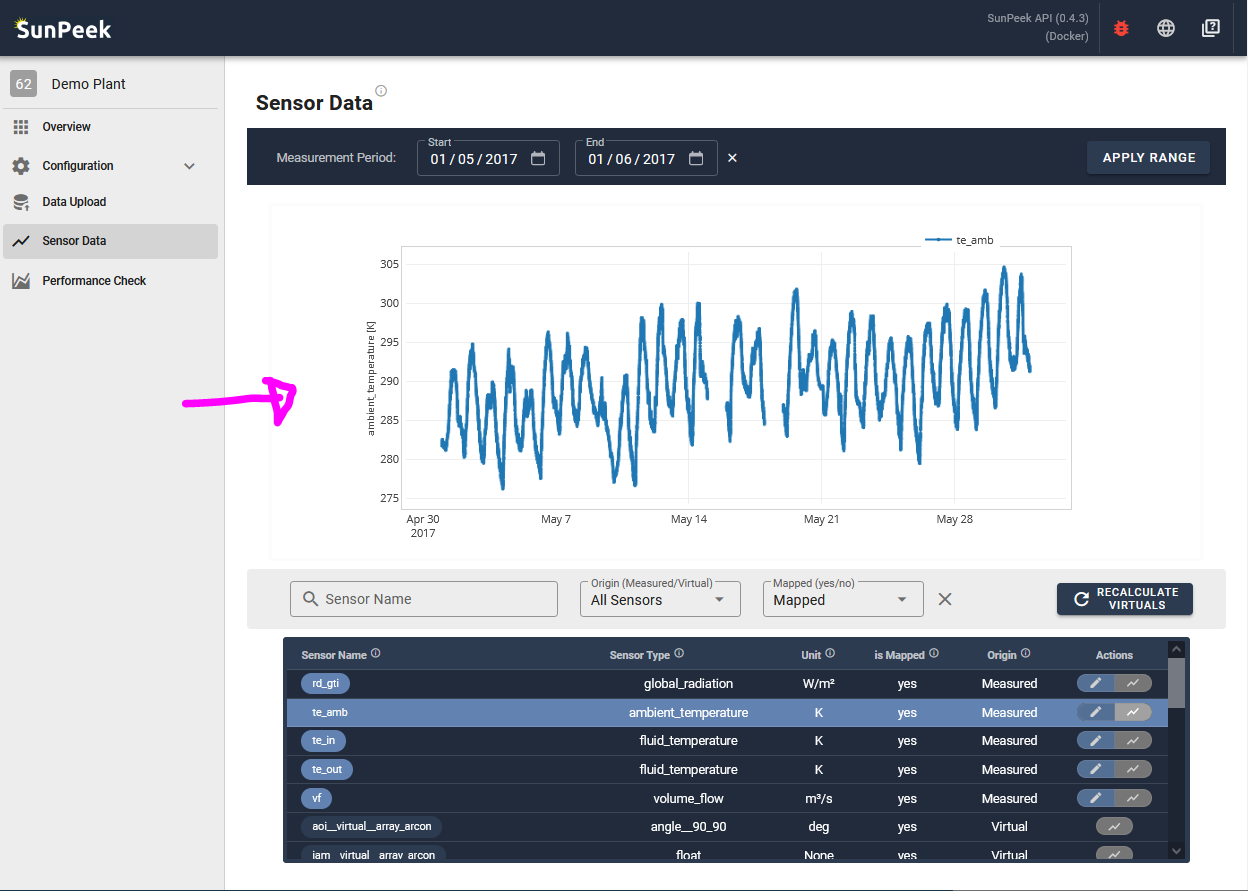
The top of the screen shows the measurement data of a selected sensor as a time chart. A user can then hover over the values to show more details, and click and drag on the data to zoom. Double-click on the screen to zoom back out.
In addition, a toolbar above the plot allows to change the time-period that is shown within the plot.
How to use this page?#
There are multiple use cases how this page might be of help.
Check that the data was imported correctly
After the import it can make sense to make a quick check if the data was imported correctly. You can randomly select some sensors to see if the values look ok:
Is the unit correct?
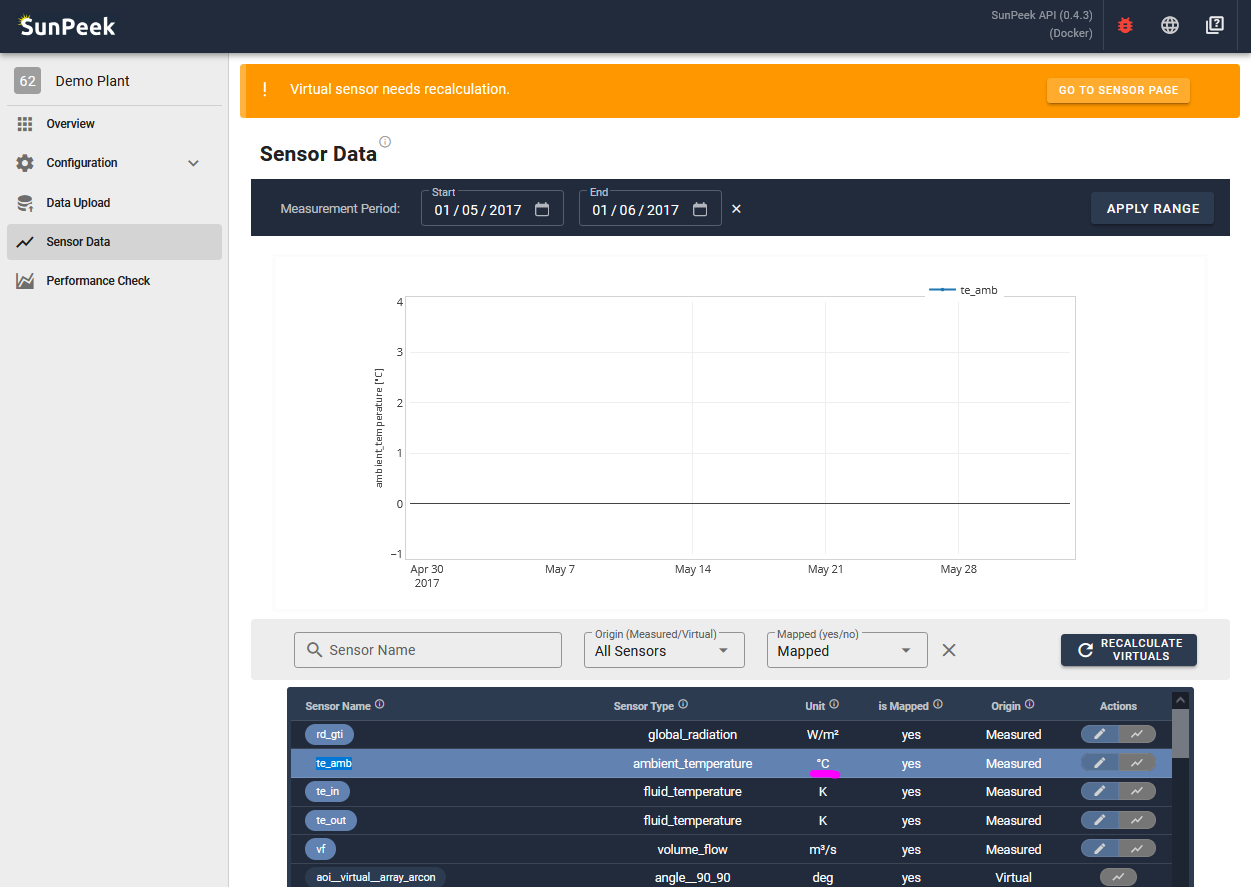
Check if the values displayed in the graph match with the unit. In some cases, the graph will show no data if the sensor readings are labeled as out-of-range (e.g. ambient temperature of 300K is ok, but 300°C would result in a NAN value). To adapt the unit, you can click on the edit button on the right. If you find that a virtual sensor has a wrong unit, it means that one of the sensors used as input has a incorrect unit.
Is the pattern correct?
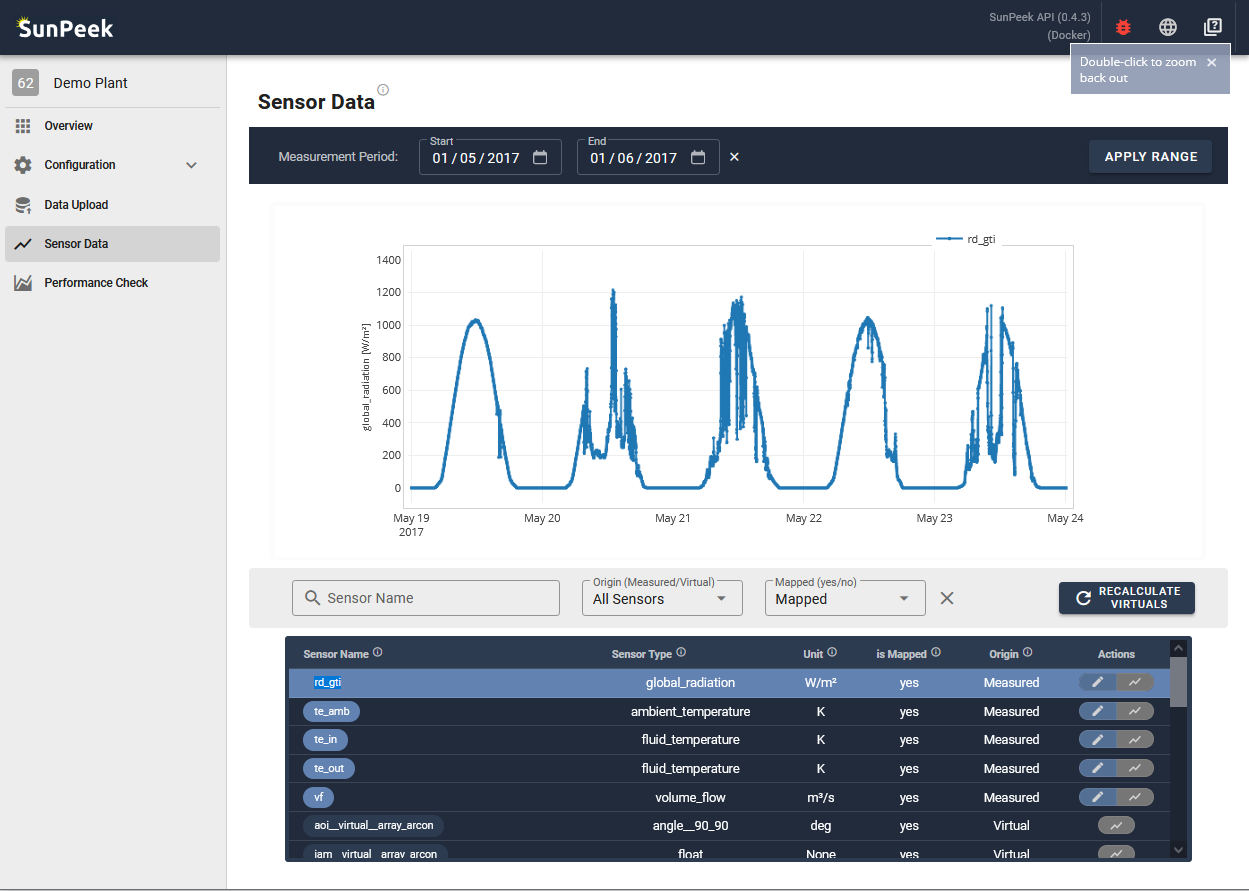
Check if the pattern of the data matches with your expectation (e.g daily pattern for irradiation). If not, it could mean the timestamps are not parsed correctly, or the sensor might show abnormal readings.
Are there any large gaps?
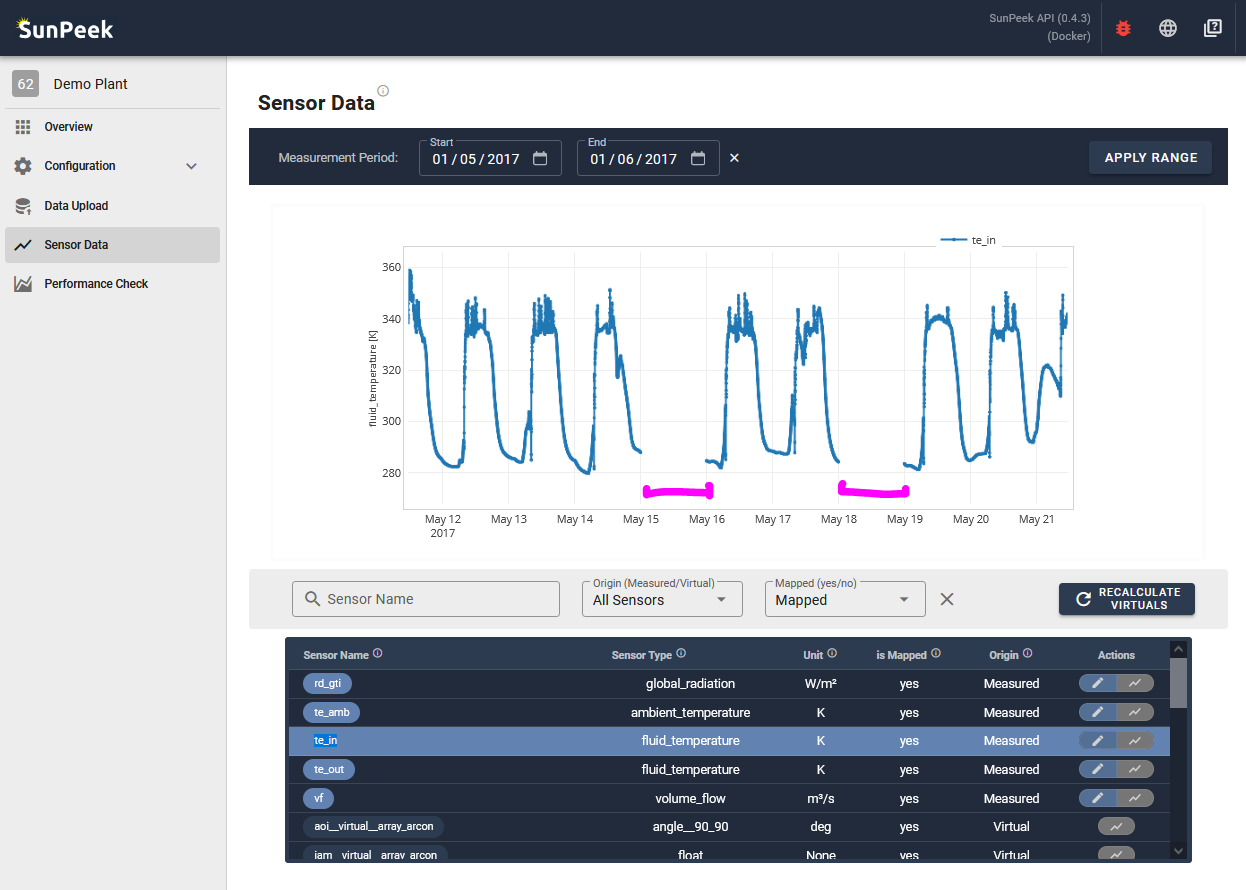
If yes, it could mean that part of the data could not be parsed either because it was not available to begin with, or it contains unknown symbols, or the values are outside the expected range for that type of sensor (e.g. 100°C for ambient temperatur).
Inspect a specific sensor
In case of errors during the execution of the Power Method (Run the Power Check) the error message will give you hints about which sensor values are missing or incorrect. With this information you might come back to the Sensor Data page to inspect the measurement data of the corresponding sensor.
Alternatively, you might locate outliers in the Power Method results which you want to investigate. In this case, you might click on a few related sensors (that are mapped) and zoom into the time-period where the outlier appeared.